Traefik Dashboard: A Vital Prerequisite for Debugging Pangolin and Middleware Manager

:globe_with_meridians: Enabling the Traefik Dashboard: A Vital Prerequisite for Debugging Pangolin and Middleware Manager

The Traefik Dashboard is an essential UI tool for visualizing and debugging your reverse proxy setup. It provides a real-time overview of routers, services, and middleware managed by Traefik—making it a powerful resource when working with Pangolin and Middleware Manager.

If you’re experiencing issues with routing or plugin configuration, this should be your first stop.


:white_check_mark: Step 1: Enable the Traefik Dashboard

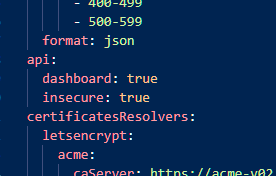
The dashboard is available when the Traefik API is enabled. In most Pangolin setups, this is already done. Check your traefik_config.yml:

api:
  dashboard: true
  insecure: true

:light_bulb: Note: insecure: true exposes the dashboard on port 8080 without authentication. Be sure to protect it using Pangolin (see Step 3).


:open_file_folder: 
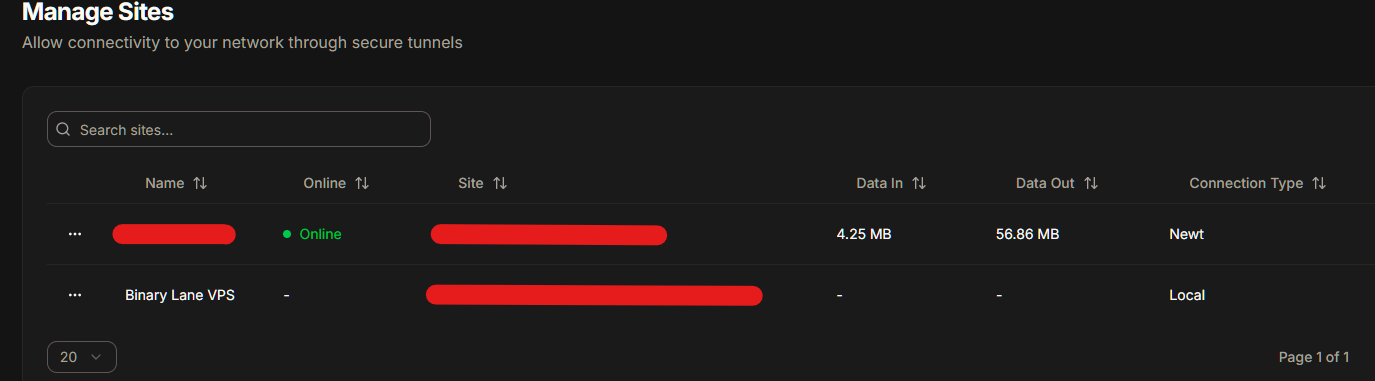
Step 2: Create a Local Site in Pangolin (if not already)

  1. Open the Pangolin UI
  2. Navigate to Sites and create a Local Site
  3. Assign it a name like local

This is necessary for mapping internal ports to subdomains.

:camera: 
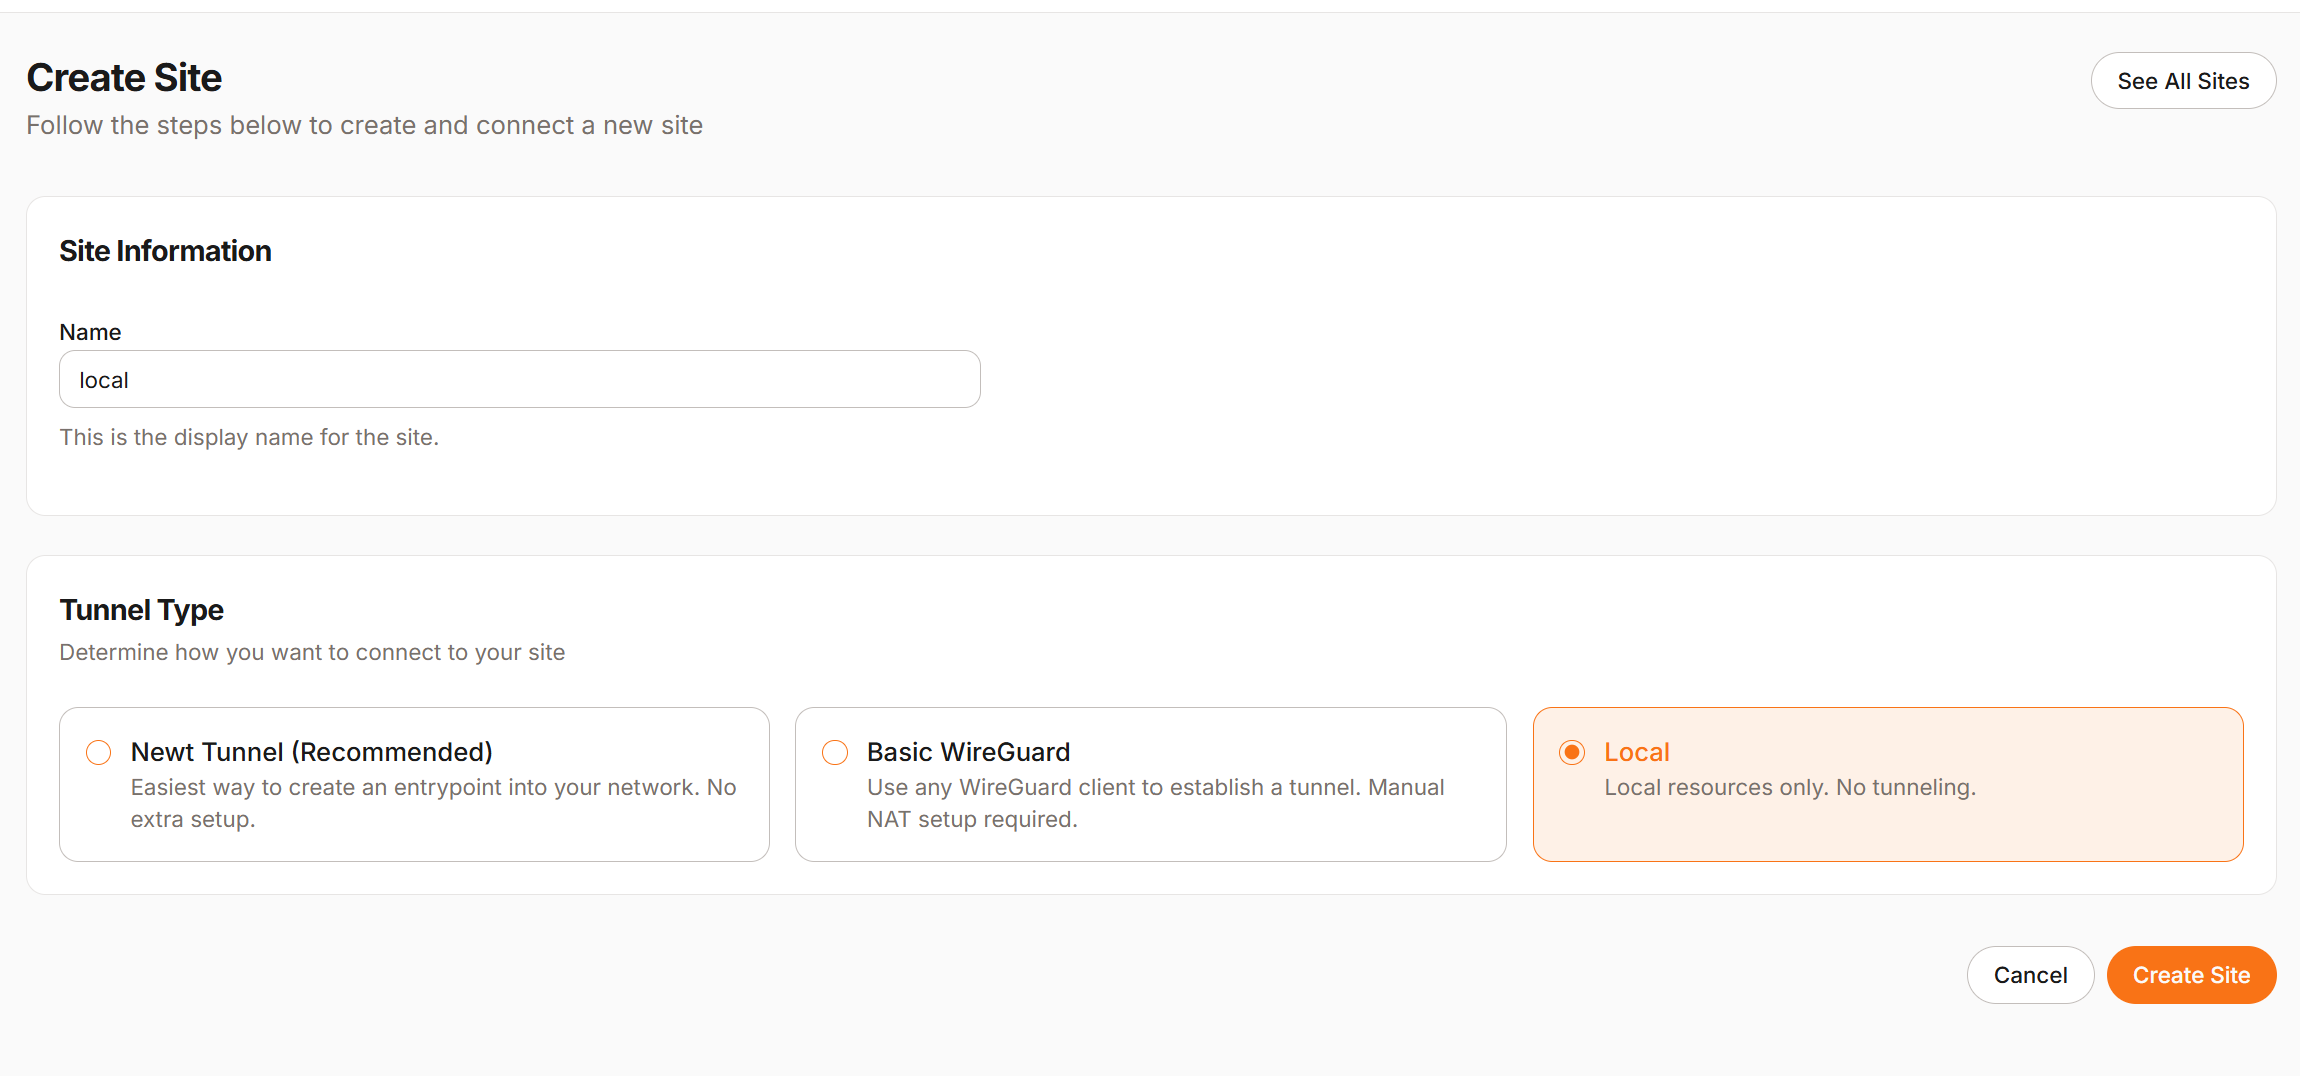
Screenshot - Creating Local Site:


:globe_showing_americas: 
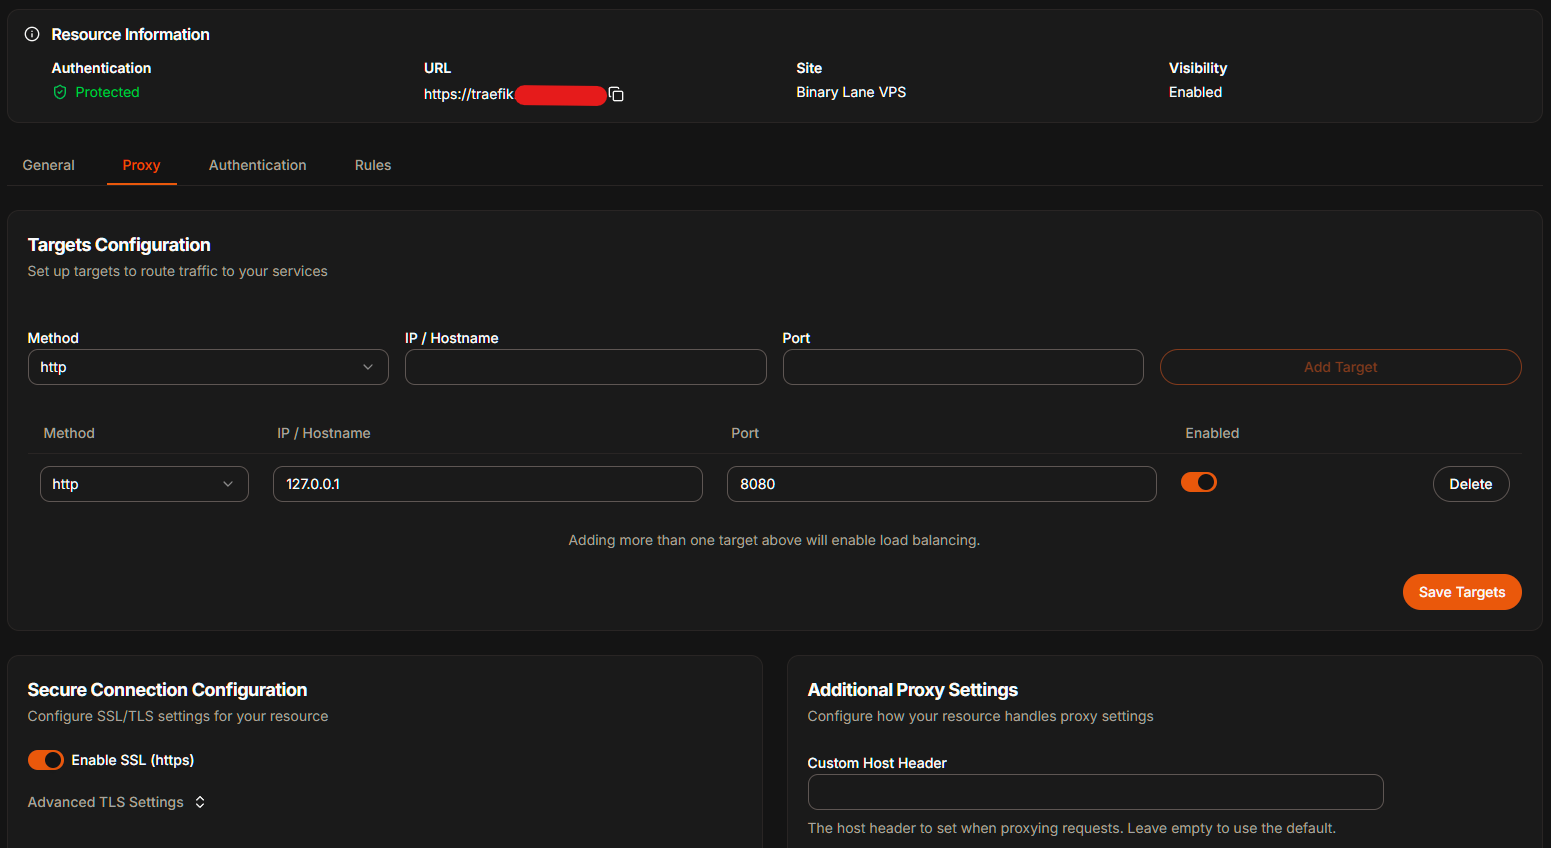
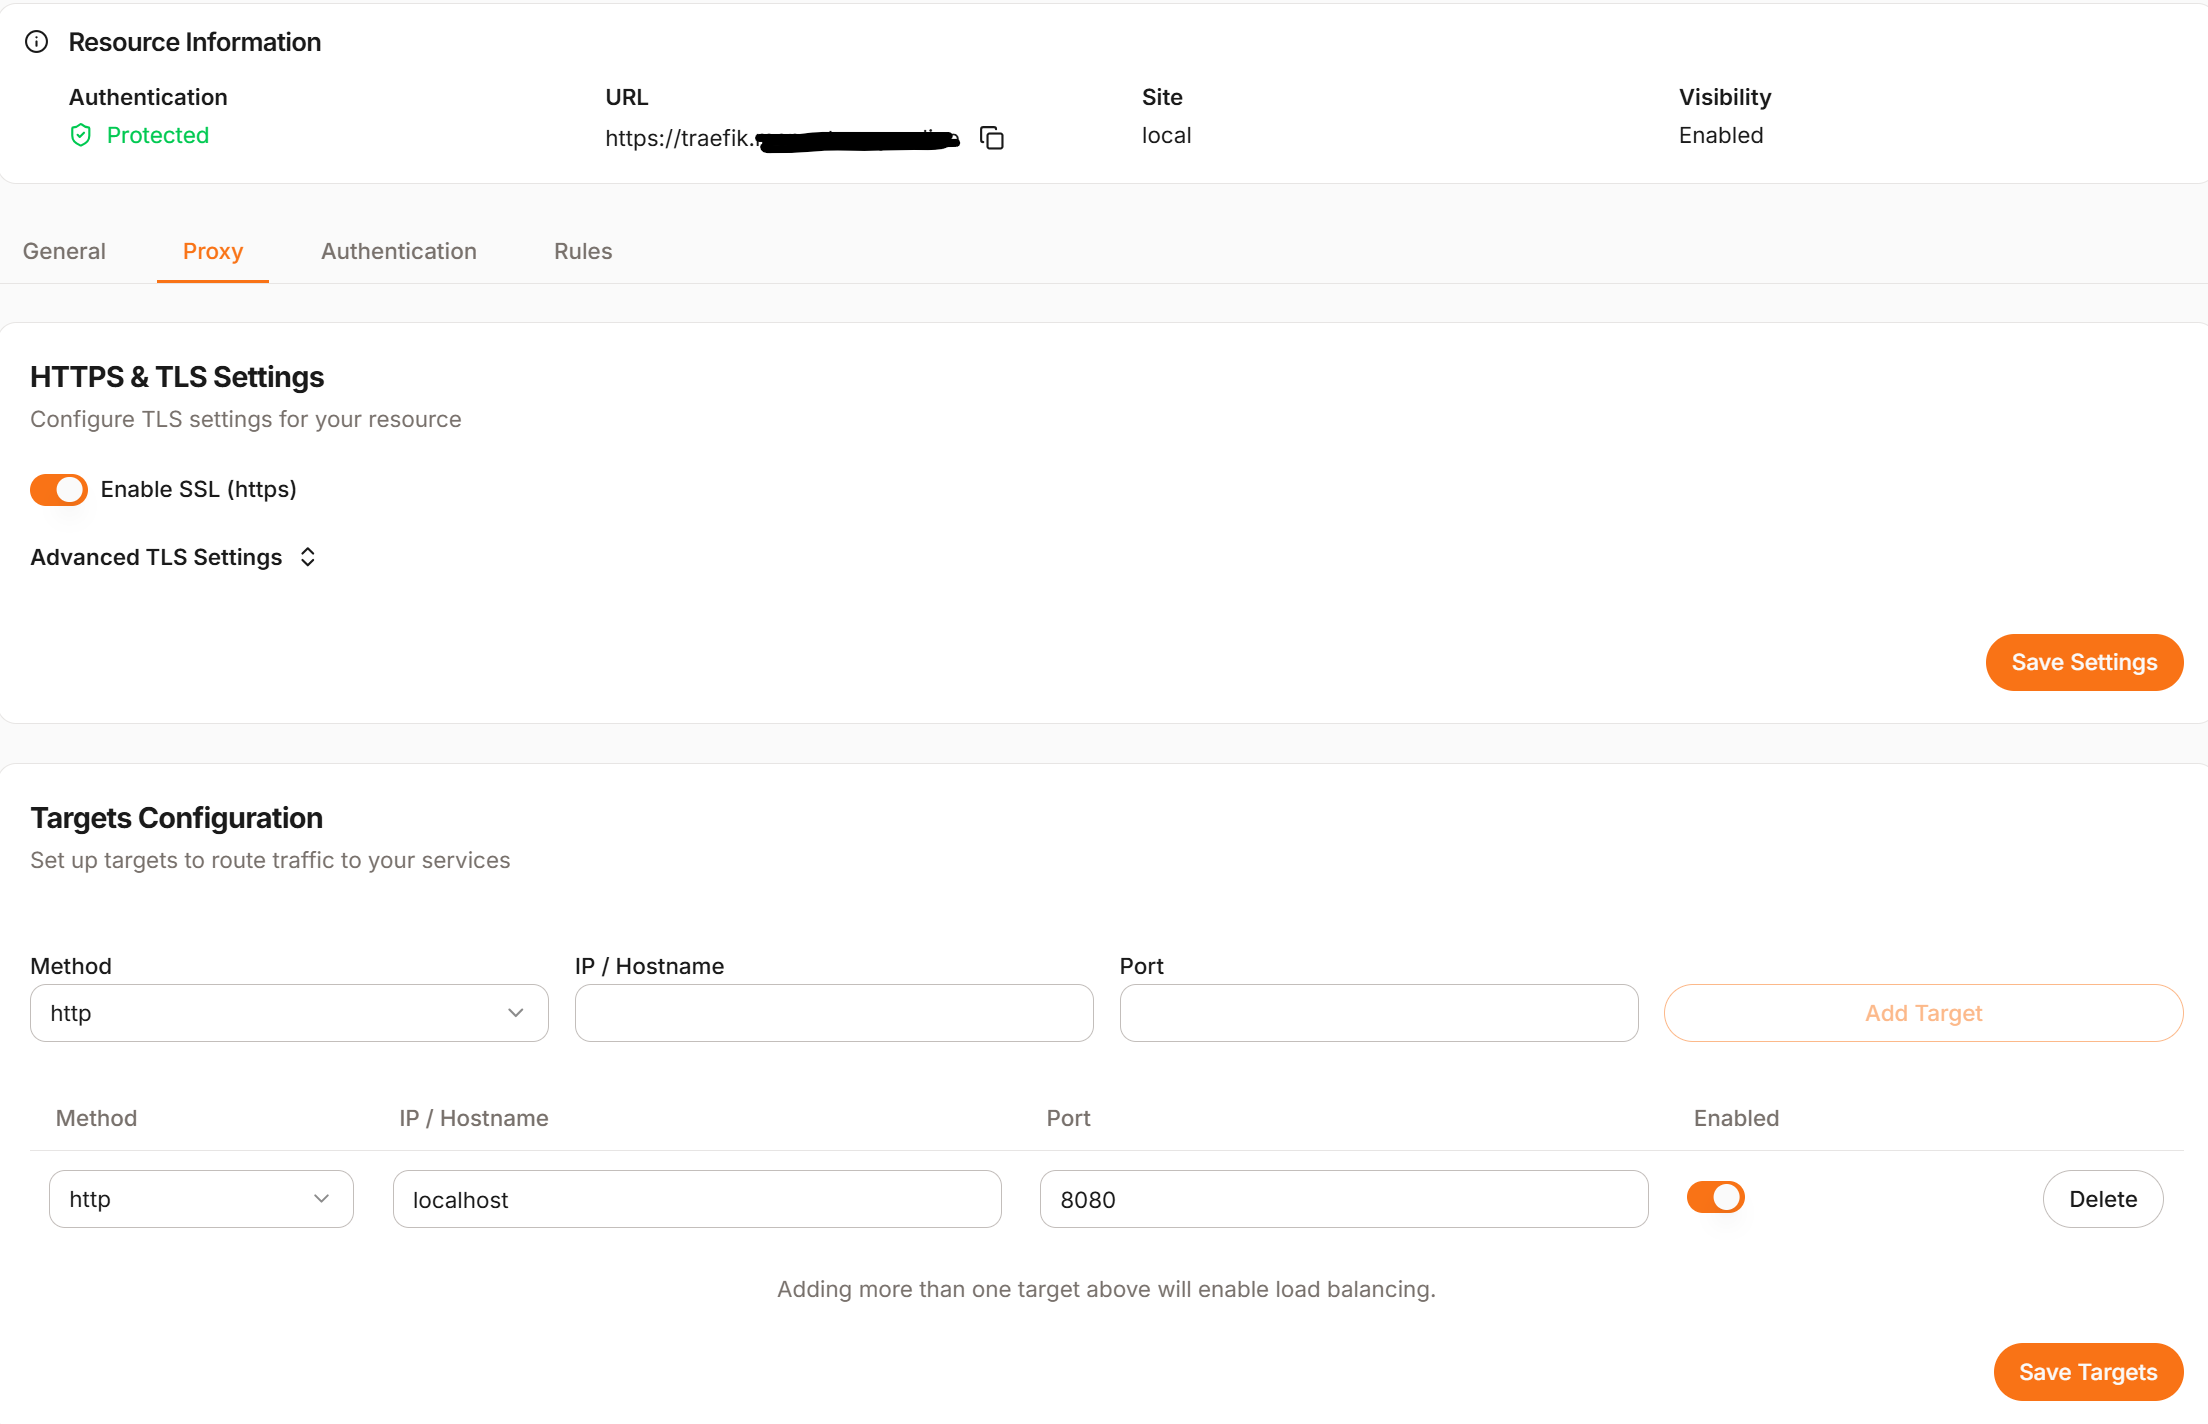
Step 3: Create a Resource for the Dashboard

  1. Go to Resources in Pangolin

  2. Click Create Resource

  3. Fill in the following:

    • Name: Traefik Dashboard
    • Domain: traefik.yourdomain.com
    • Site: Select your local site (e.g., local)
    • Target: localhost:8080
  4. Under Authentication, assign a valid user/role to prevent unauthorized access

:camera: Screenshot - Creating Pangolin Resource for traefik.yourdomain.com:


:globe_with_meridians: 
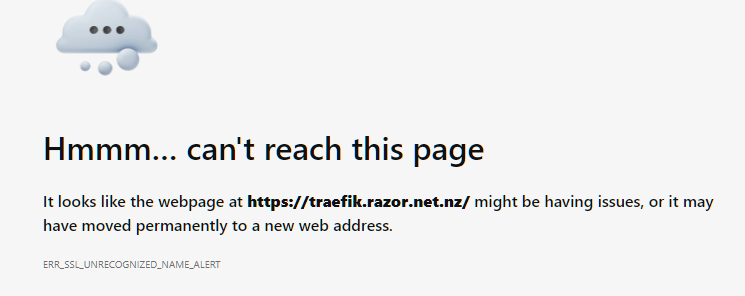
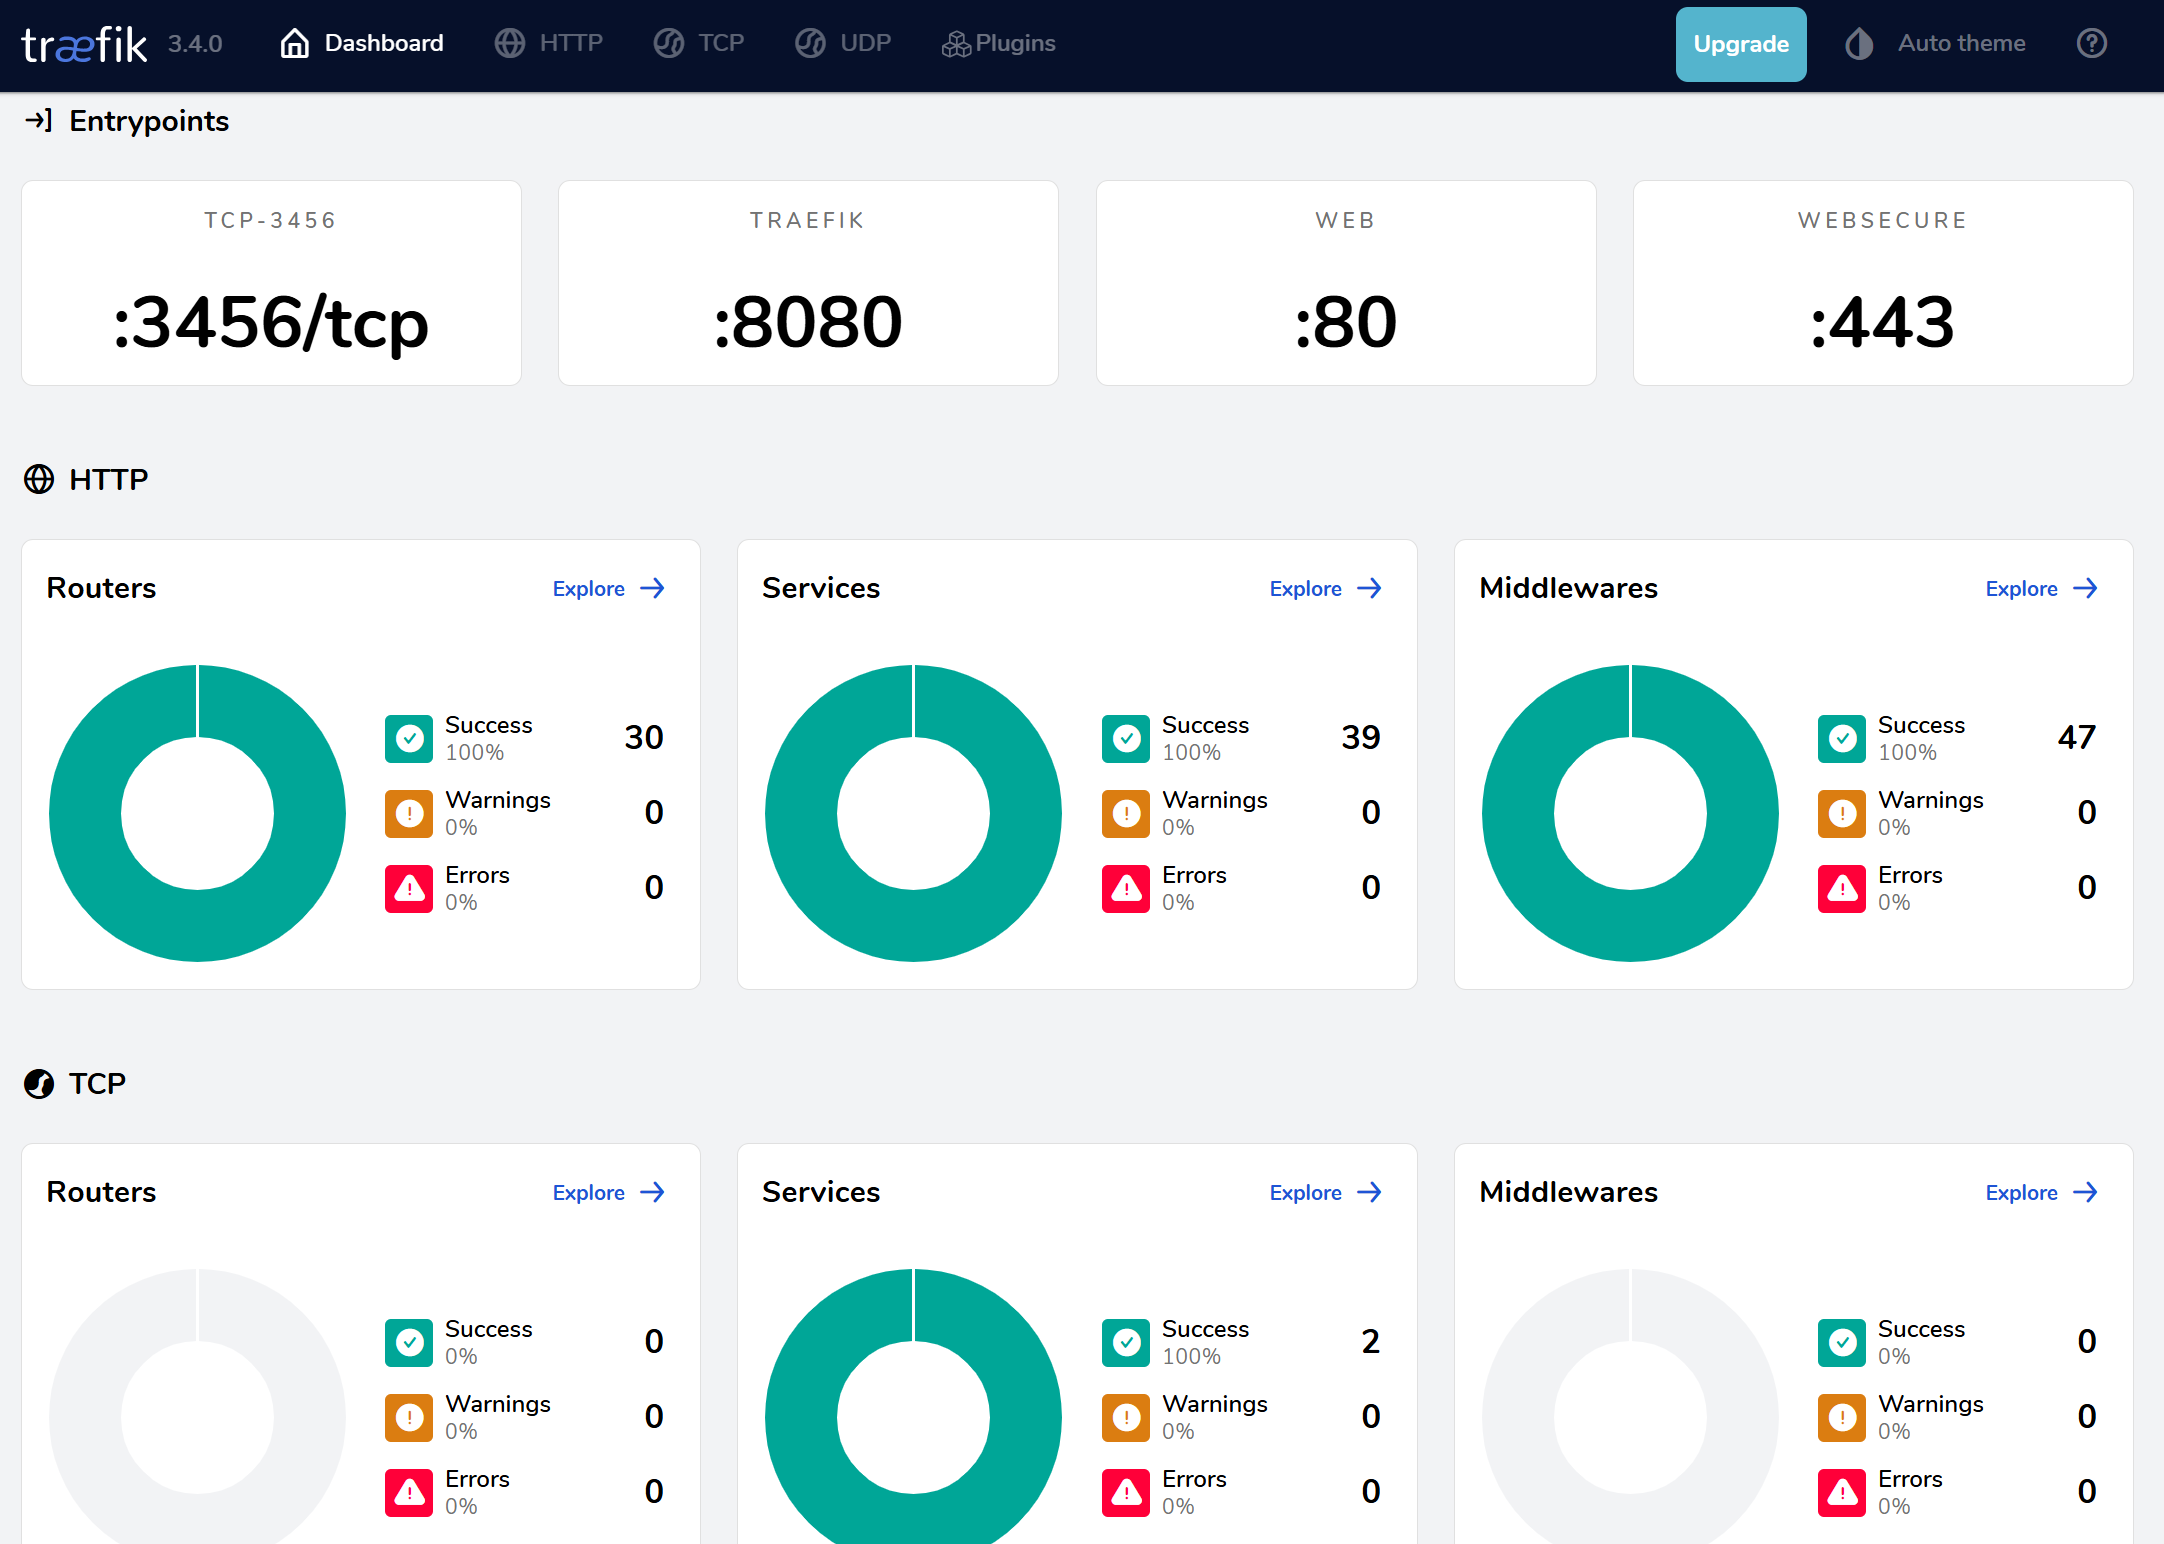
Step 4: Access the Dashboard

Visit:

https://traefik.yourdomain.com

You should be prompted for credentials (if configured and not already logged in to Pangolin), and then you’ll see the Traefik dashboard.

:camera: Screenshot Suggestion: Screenshot of the Traefik dashboard showing Routers, Services, and Middleware


:warning: Step 5: Troubleshooting with the Dashboard

Use the dashboard to:

  • :red_circle: Identify broken routers (red = error, yellow = warning)
  • :page_facing_up: See what services are active and properly mapped
  • :sewing_needle: Inspect middleware chains applied to each route
  • :newspaper: Confirm whether plugins or config files have been applied after changes in Middleware Manager

:light_bulb: Pro Tip: Any time you update Middleware Manager, double-check the dashboard to verify configuration changes.


:folded_hands: Final Note

The Traefik dashboard is a must-have tool for diagnosing and debugging complex routing scenarios, especially when using Middleware Manager to manage dynamic plugins and advanced configs. Protect it with Pangolin authentication and keep it in your toolkit!

Happy debugging! :wrench:

11 Likes

Thanks for a guide. Even this is a straightforward process it doesn’t work for me. In traefik_config.yml both values are set to true. When I configure a resource pointing it to localhost:8080, or 127.0.0.1:8080, I got “Bad Gateway” message when trying accessing site over public URL. Had the same for middleware-manager, but when I placed a docker IP address for it instead localhost, it worked. Unfortunately for Traefik, Docker IP is not being assigned so not sure what’s the problem. Any thoughts?

1 Like

I assume you mean you have set up a resource in pangolin to provide a subdomain for Traefik. If so, ensure you are using a local site and not a site that uses a newt connection

1 Like

That did the trick. I used newt instead local. Once switched to local, I can access Traefik dashboard. Thanks for fast response. I really appreciate what you are doing here. Plenty of useful resources and guides. Thank you.

1 Like

Hi there. I have followed this guide to the letter (other than trying ‘127.0.0.1’ instead of ‘localhost’ when the latter did not work, and when I attempt to visit the URL of the Traefik Dashboard, I get the below screen:

Below is some snips of my config which as you can see mirror what you suggest. Any idea where I am going wrong? I am using DNS Challenge for my SSL certs instead of HTTPS if that’s at all relevant, but all other URL’s (on the Newt site) work fine.

1 Like

That’s strange. Looks like you have everything. You could to create a Test Resource and see if that works for you to rule out any host firewall issues

Add to docker-compose.yml:

python-http:
    image: python:3.11-slim
    container_name: python-http
    working_dir: /app
    command: python -m http.server 15000
    ports:
      - "15000:15000"
    restart: unless-stopped

Then in Pangolin:

Create resource mywebsite.yourdomain.com
Point to: python-http port 15000

If you see an empty directory listing then you know that pangolin subdomain mapping is working.

2 Likes

So I’m an idiot, but i figure i better document my idiocy in case anyone else makes the same mistake.

I have a split DNS setup where traffic to mydomain outside my local network goes via Pangolin, but traffic to *.mydomain inside my local network goes via NPM and is resolved locally. On my local DNS host(AdGuard Home), pangolin.mydomain is explicitly pointed at my Pangolin VPS.

The issue here was that I hadn’t clicked that I needed to create an explicit DNS record pointing at traefik.mydomain in my local DNS host so that it didn’t get pointed at NPM via the wildcard redirect. So it was trying to resolve an SSL cert for a url that wasn’t even on NPM.

Figured it out when I followed your instructions above on my tablet while sitting at a cafe, and when I got to the Pangolin part I tried the Traefik link one more time just to confirm it was still broken. Worked fine, that’s when I clicked the issue was the split DNS.

With an explicit DNS record in place for traefik.mydomain locally, everything works great. Thanks.

2 Likes

THANK YOU!!

I was trying for way too long before I decided to scroll down a bit. I used the guide and initially it was working, which was a lucky coincidence cause I just happened to manually set a DNS server on my laptop to test something.

Later, when I removed the manual DNS server, accessing the VPS’ Traefik Dashboard stopped working, since my Adguard rewrote my query :man_facepalming:

1 Like

Very nice I missed the traefik dashboard, works great…thank you.

1 Like

Where would you add the label traefik-auth.basicauth.users=admin:$$2y$$05$$8Ue to enable insecure: false

1 Like

If you use the middleware manager you can apply the basic auth middleware. Otherwise you will have to look putting the middleware in your traefik’s dynamic_config.yml

1 Like