Visualizing Your Traefik Traffic: Deploy the Enhanced Traefik Log Dashboard with OpenTelemetry Support
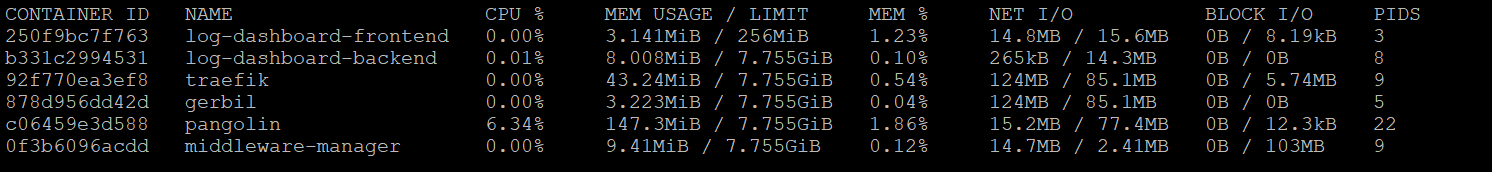
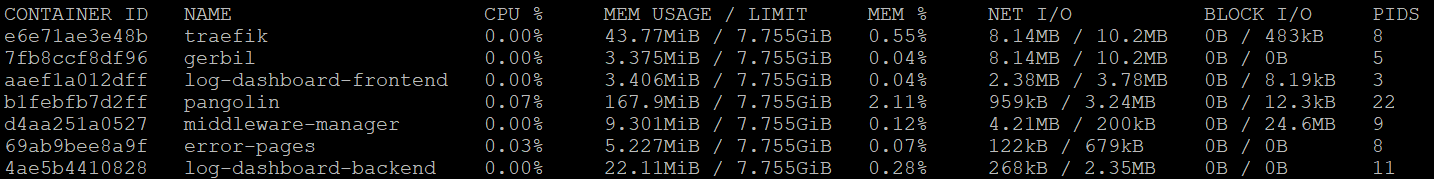
Usage Load for the containers
If you’re using the powerful Pangolin stack with Traefik as your reverse proxy, you’re already handling traffic like a pro. But what about monitoring that traffic in real-time? Raw log files and scattered metrics can make it challenging to get a comprehensive view of what’s happening across your infrastructure.
This is where the enhanced Traefik Log Dashboard truly shines. It’s evolved into a comprehensive monitoring solution that provides clean, real-time visualization of your Traefik traffic through multiple data sources - traditional log parsing, modern OpenTelemetry traces, and enhanced geolocation analytics.
In this guide, we’ll show you how to seamlessly integrate the latest Traefik Log Dashboard into your existing Pangolin docker-compose setup with both traditional log monitoring and cutting-edge OpenTelemetry support.
What’s New in the Latest Version
The Traefik Log Dashboard has undergone significant enhancements:
-
OpenTelemetry OTLP Support: Direct real-time telemetry ingestion from Traefik v3.0+
-
Enhanced Geolocation: MaxMind GeoIP2 integration with offline database support
-
Hybrid Data Sources: Simultaneously monitor via OTLP traces AND traditional log files
-
Advanced Analytics: Real-time request rates, response times, error tracking, and geographic distribution
-
Smart Filtering: Hide unknown services, private IPs, with advanced pagination
-
Production Ready: Resource limits, health checks, and performance optimizations
-
Easy Deployment: Multiple deployment modes with Docker Compose profiles
Prerequisites
Before we start, ensure you have the following installed on your system:
-
Docker & Docker Compose
-
Traefik v3.0+ (for OTLP support) or v2.x (for log-only mode)
This guide assumes you already have a basic Pangolin stack running. We’ll be adding the enhanced Traefik Log Dashboard services to it.
Step 1: Choose Your Monitoring Approach
The dashboard now supports three monitoring modes:
Option A: OpenTelemetry Only (Recommended - Real-time)
Modern approach using Traefik’s built-in OTLP exporter for immediate trace data.
Option B: Log Files Only (Traditional)
Parse structured JSON log files - works with any Traefik version.
Option C: Hybrid Mode (Best of Both)
Combine real-time OTLP with historical log data for complete visibility.
Step 2: Configure Traefik for Enhanced Monitoring
For OpenTelemetry Support (Recommended)
Update your traefik_config.yml to enable both OTLP tracing and traditional logging:
# ./config/traefik/traefik_config.yml

log:
  level: INFO
  filePath: "/var/log/traefik/traefik.log"
  format: json

# Traditional JSON access logs (optional with OTLP)
accessLog:
  filePath: "/var/log/traefik/access.log"
  format: json

# NEW: OpenTelemetry Tracing Configuration
tracing:
  otlp:
    http:
      endpoint: "http://log-dashboard-backend:4318/v1/traces"
    # Alternative: GRPC for better performance
    # grpc:
    #   endpoint: "log-dashboard-backend:4317"
    #   insecure: true

  # Sampling rate (adjust for your needs)
  sampleRate: 1.0  # 100% for development, 0.1 (10%) for production

  # Global attributes added to all traces
  globalAttributes:
    environment: "production"
    service.version: "v3.0"
    deployment.environment: "pangolin"
For Log Files Only
If you prefer the traditional approach or are using an older Traefik version:
# ./config/traefik/traefik_config.yml

log:
  level: INFO
  filePath: "/var/log/traefik/traefik.log"

accessLog:
  filePath: "/var/log/traefik/access.log"
  format: json # <-- Essential for dashboard parsing
  fields:
    defaultMode: keep
    headers:
      defaultMode: keep
      names:
        User-Agent: keep
        Authorization: drop
Step 3: Add Enhanced Dashboard to Your docker-compose.yml
Here’s your updated docker-compose.yml with the enhanced dashboard services:
name: pangolin
services:
  pangolin:
    image: fosrl/pangolin:1.5.1
    container_name: pangolin
    restart: unless-stopped
    volumes:
      - ./config:/app/config
    healthcheck:
      test: ["CMD", "curl", "-f", "http://localhost:3001/api/v1/"]
      interval: "10s"
      timeout: "10s"
      retries: 15

  gerbil:
    image: fosrl/gerbil:1.0.0
    container_name: gerbil
    restart: unless-stopped
    depends_on:
      pangolin:
        condition: service_healthy
    command:
      - --reachableAt=http://gerbil:3003
      - --generateAndSaveKeyTo=/var/config/key
      - --remoteConfig=http://pangolin:3001/api/v1/gerbil/get-config
      - --reportBandwidthTo=http://pangolin:3001/api/v1/gerbil/receive-bandwidth
    volumes:
      - ./config/:/var/config
    cap_add:
      - NET_ADMIN
      - SYS_MODULE
    ports:
      - "51820:51820/udp"
      - "8080:8080"
      - "443:443"
      - "80:80"

  traefik:
    image: traefik:v3.4.0
    container_name: traefik
    restart: unless-stopped
    network_mode: service:gerbil
    depends_on:
      pangolin:
        condition: service_healthy
    command:
      - --configFile=/etc/traefik/traefik_config.yml
    volumes:
      - ./config/traefik:/etc/traefik:ro
      - ./config/letsencrypt:/letsencrypt
      - ./config/traefik/logs:/var/log/traefik
      - ./traefik/plugins-storage:/plugins-storage:rw

  # --- Enhanced Traefik Log Dashboard with OTLP Support ---

  log-dashboard-backend:
    image: ghcr.io/hhftechnology/traefik-log-dashboard-backend:latest
    container_name: log-dashboard-backend
    restart: unless-stopped
    ports:
      - "4317:4317"   # OTLP GRPC endpoint
      - "4318:4318"   # OTLP HTTP endpoint
    volumes:
      - ./config/traefik/logs:/logs:ro
      - ./config/maxmind:/maxmind:ro
    environment:
      # Basic configuration
      - PORT=3001
      - TRAEFIK_LOG_FILE=/logs/access.log

      # OTLP Configuration (NEW)
      - OTLP_ENABLED=true
      - OTLP_GRPC_PORT=4317
      - OTLP_HTTP_PORT=4318

      # MaxMind GeoIP (Enhanced)
      - USE_MAXMIND=true
      - MAXMIND_DB_PATH=/maxmind/GeoLite2-City.mmdb
      - MAXMIND_FALLBACK_ONLINE=true

      # Performance optimization
      - GOGC=50
      - GOMEMLIMIT=500MiB
    healthcheck:
      test: ["CMD", "wget", "--quiet", "--tries=1", "--spider", "http://localhost:3001/health"]
      interval: 30s
      timeout: 10s
      retries: 3
    deploy:
      resources:
        limits:
          cpus: '1.0'
          memory: 512M
        reservations:
          cpus: '0.2'
          memory: 128M

  log-dashboard-frontend:
    image: ghcr.io/hhftechnology/traefik-log-dashboard-frontend:latest
    container_name: log-dashboard-frontend
    restart: unless-stopped
    ports:
      - "3000:80"
    environment:
      - BACKEND_SERVICE=log-dashboard-backend
      - BACKEND_PORT=3001
    depends_on:
      - log-dashboard-backend
    healthcheck:
      test: ["CMD", "wget", "--quiet", "--tries=1", "--spider", "http://localhost/"]
      interval: 30s
      timeout: 10s
      retries: 3
    deploy:
      resources:
        limits:
          cpus: '0.5'
          memory: 256M
        reservations:
          cpus: '0.1'
          memory: 64M

  # Optional: MaxMind GeoIP Database Updater
  maxmind-updater:
    image: alpine:latest
    container_name: maxmind-db-updater
    restart: "no"
    volumes:
      - ./config/maxmind:/data
    environment:
      - MAXMIND_LICENSE_KEY=${MAXMIND_LICENSE_KEY:-your-license-key-here}
    command: >
      sh -c "
        apk add --no-cache wget tar &&
        cd /data &&
        if [ ! -f GeoLite2-City.mmdb ] || [ $$(find . -name 'GeoLite2-City.mmdb' -mtime +7) ]; then
          echo 'Downloading/updating MaxMind database...' &&
          wget -O GeoLite2-City.tar.gz 'https://download.maxmind.com/app/geoip_download?edition_id=GeoLite2-City&license_key=$$MAXMIND_LICENSE_KEY&suffix=tar.gz' &&
          tar --wildcard -xzf GeoLite2-City.tar.gz --strip-components=1 '*/GeoLite2-City.mmdb' &&
          rm -f GeoLite2-City.tar.gz &&
          echo 'MaxMind database updated successfully'
        else
          echo 'MaxMind database is up to date'
        fi
      "

networks:
  default:
    driver: bridge
    name: pangolin
What’s Enhanced in the New Setup?
OpenTelemetry Integration
-
Real-time traces: Get immediate visibility into requests as they happen
-
OTLP endpoints: Both HTTP (4318) and GRPC (4317) support for maximum compatibility
-
Hybrid monitoring: Combine OTLP traces with traditional log parsing
Advanced Geolocation
-
MaxMind GeoIP2: Offline IP geolocation with city-level accuracy
-
Automatic updates: Database refreshes weekly for accuracy
-
Privacy-focused: Optional offline-only mode
Enhanced Analytics
-
Real-time metrics: Request rates, response times, error tracking
-
Geographic visualization: Interactive world map showing request origins
-
Service insights: Detailed router and service performance analytics
 Production Optimizations
-
Resource limits: Controlled CPU and memory usage
-
Health checks: Comprehensive monitoring of service health
-
Performance tuning: Optimized garbage collection and memory management
Step 4: Setup MaxMind GeoIP (Recommended)
For enhanced geographic insights, set up MaxMind GeoIP:
-
Get a free MaxMind account: Sign up at https://www.maxmind.com/en/geolite2/signup
-
Generate a license key from your account dashboard
-
Set the environment variable:
export MAXMIND_LICENSE_KEY=your_license_key_here -
Create the directory:
mkdir -p ./config/maxmind
The MaxMind updater will automatically download the database on first run.
Step 5: Launch Your Enhanced Stack
With all configurations in place, let’s bring everything online:
# Navigate to your Pangolin directory
cd /path/to/your/pangolin

# Start all services
docker compose up -d

# Check service health
docker compose ps
Step 6: Explore Your Enhanced Dashboard!
Open your web browser and navigate to:
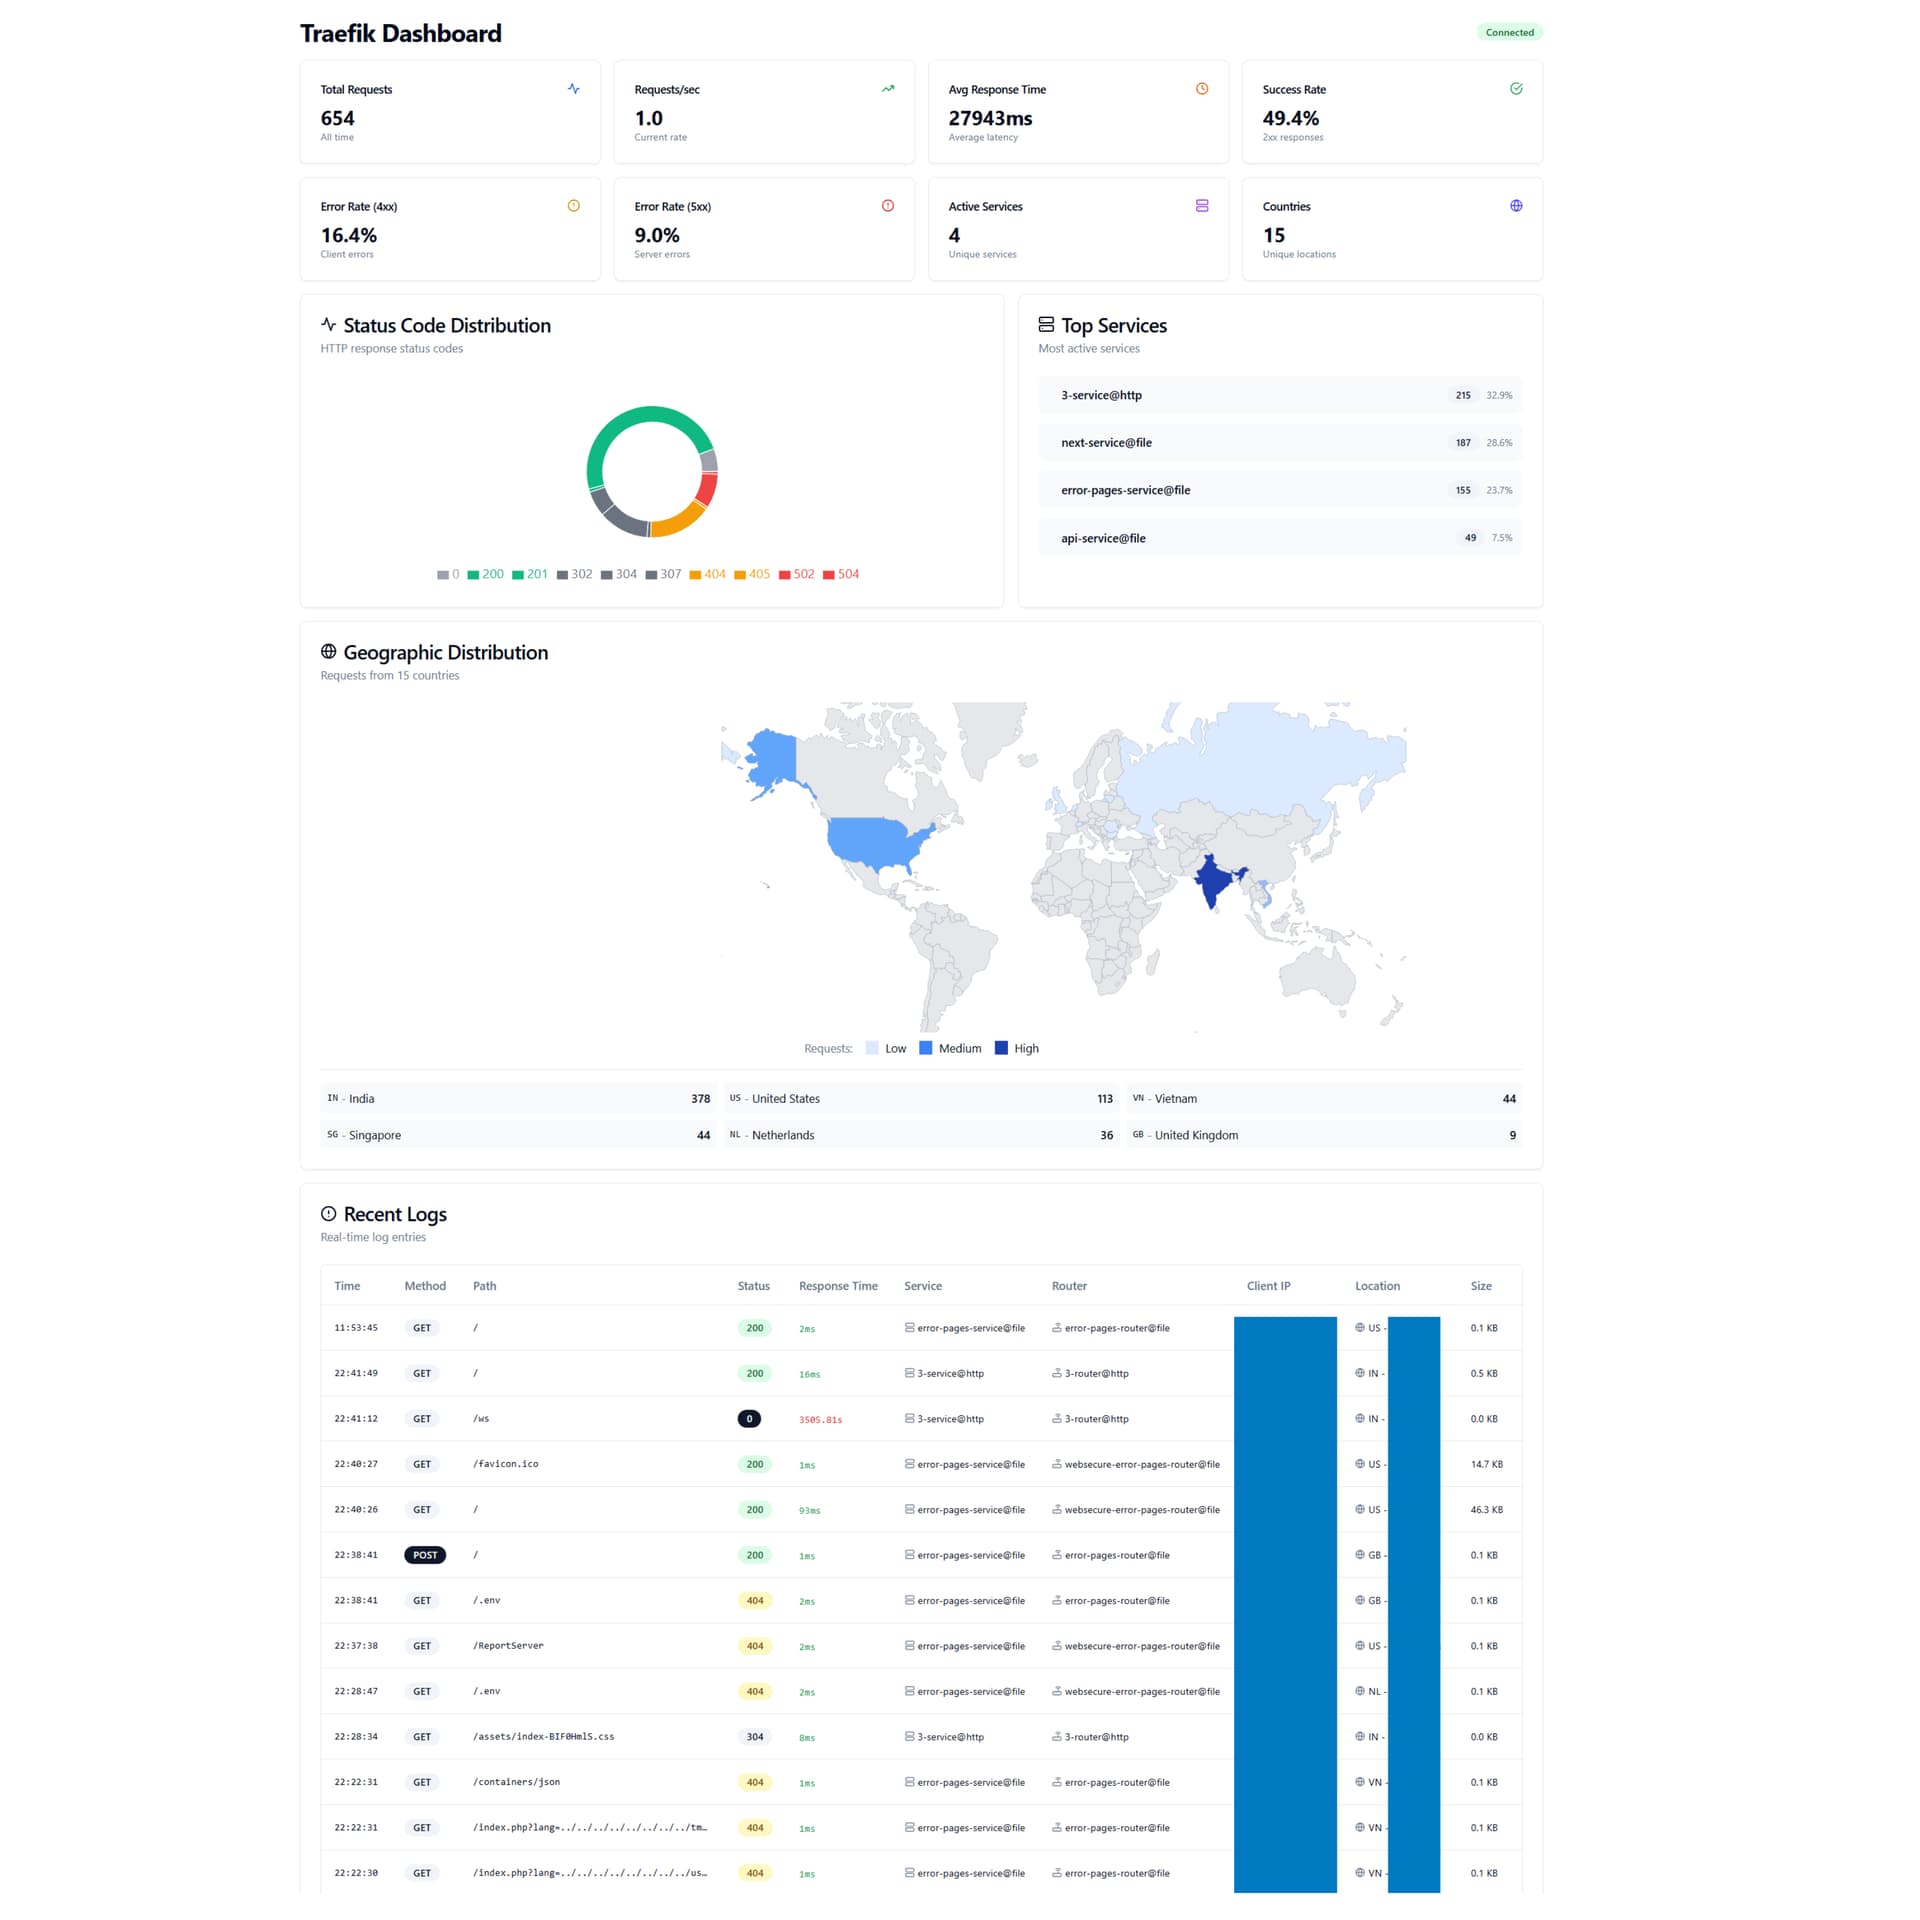
You’ll now see a comprehensive dashboard featuring:
-
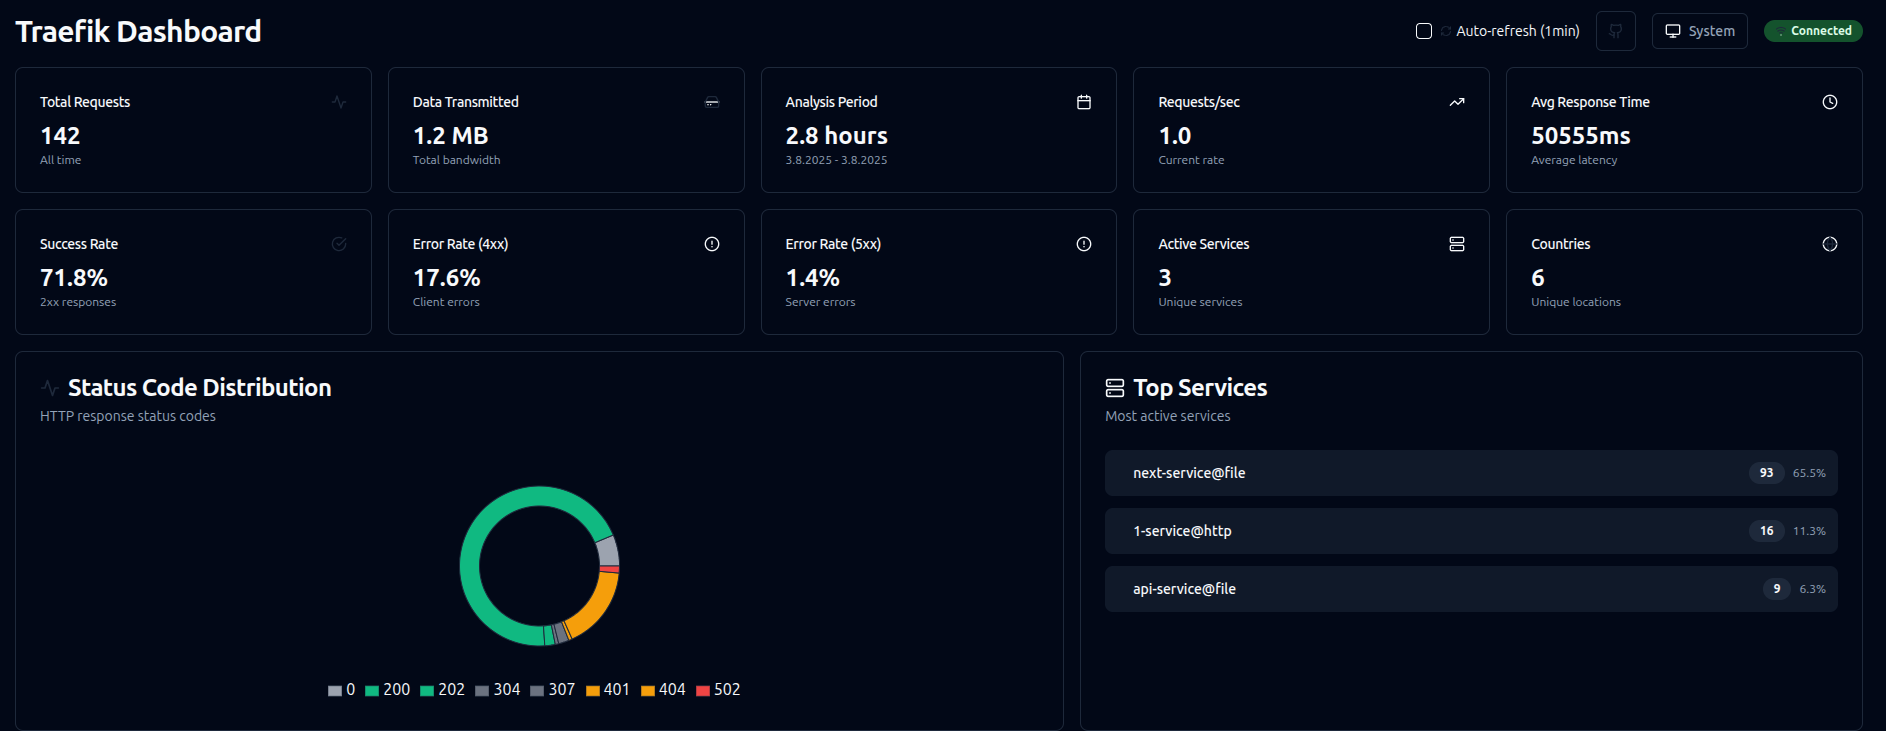
Real-time Statistics: Live request counts, response times, error rates
-
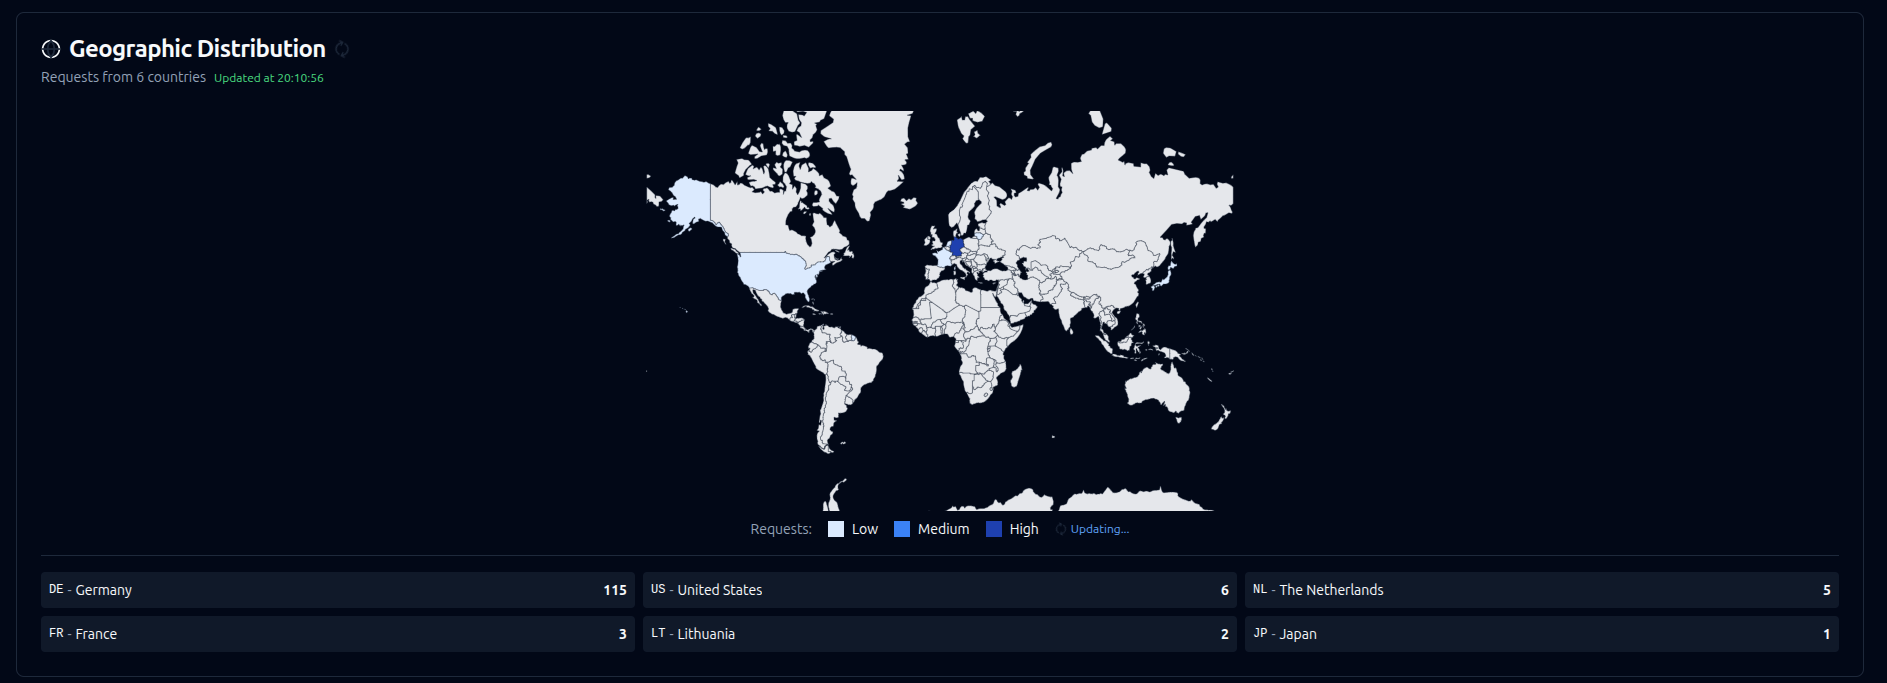
Geographic Map: Interactive world map showing request origins
-
Status Code Analytics: Visual breakdown of HTTP response codes
-
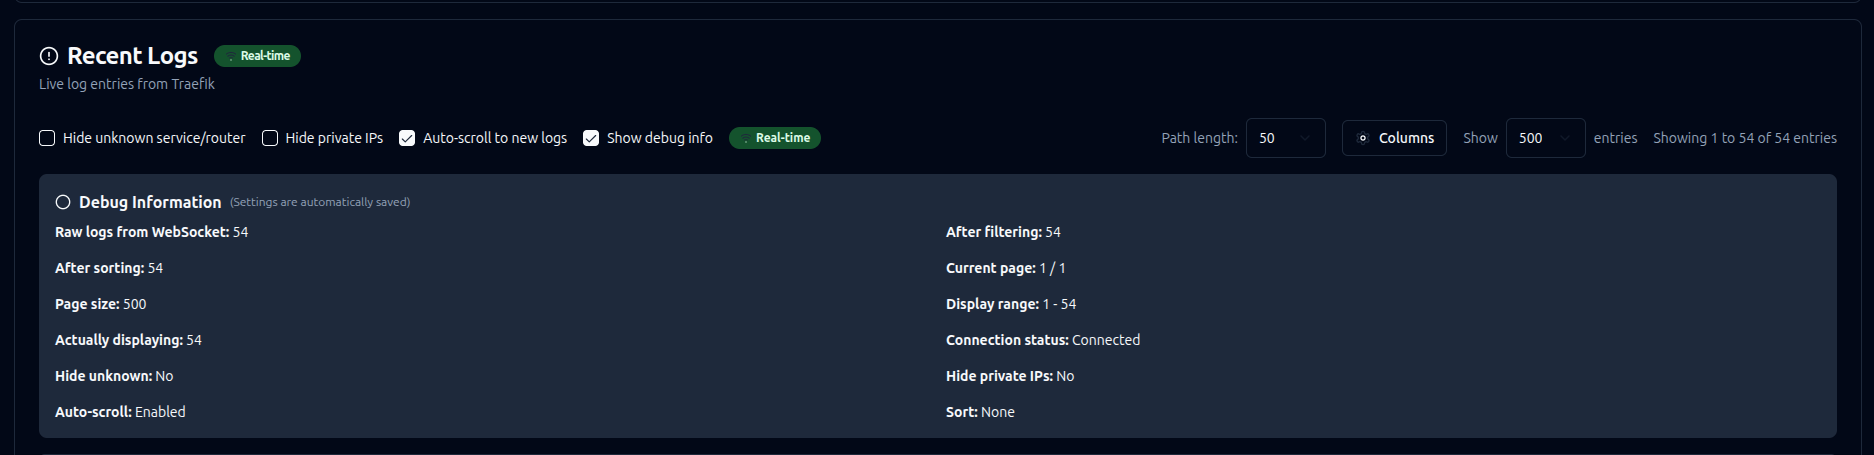
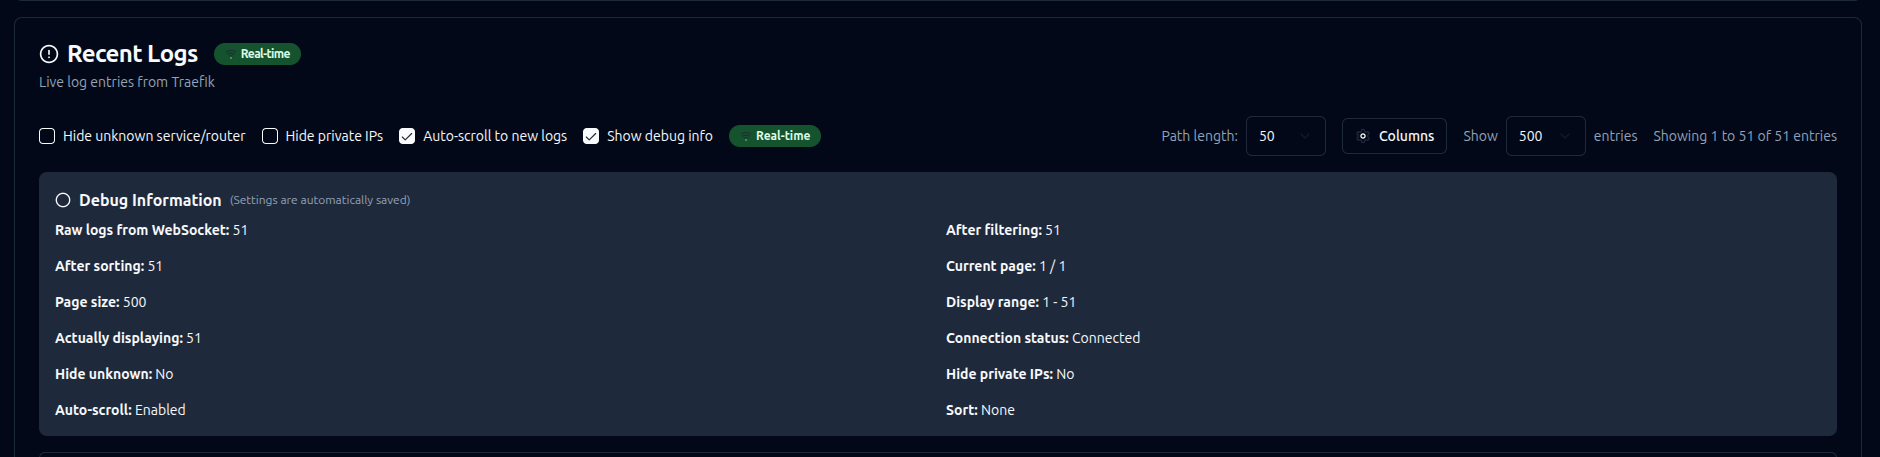
Advanced Log Table: Searchable, filterable request logs with pagination
-
Service Insights: Performance metrics by service and router
-
Live Updates: Real-time data via WebSocket connections
Key Dashboard Features
-
Dual Data Sources: See both OTLP traces (real-time) and log entries (historical)
-
Smart Filtering: Hide unknown services, private IPs, or apply custom filters
-
Geographic Intelligence: See exactly where your traffic is coming from
-
Performance Monitoring: Track response times, error rates, and throughput
-
Service Analytics: Understand which services are most active
Step 7: Performance Optimization (Optional)
For high-traffic environments, consider these optimizations:
Reduce OTLP Sampling
# In traefik_config.yml
tracing:
  sampleRate: 0.1  # 10% sampling for production
Use GRPC for Better Performance
# In traefik_config.yml
tracing:
  otlp:
    grpc:
      endpoint: "log-dashboard-backend:4317"
      insecure: true
Optimize Resource Usage
# In docker-compose.yml
environment:
  - GOGC=20  # More aggressive garbage collection
  - GOMEMLIMIT=1GiB
Troubleshooting Common Issues
OTLP Data Not Appearing
-
Verify Traefik configuration points to correct endpoint
-
Check that OTLP ports (4317/4318) are accessible
-
Ensure sampling rate > 0
Log Files Not Loading
-
Verify log file path:
./config/traefik/logs:/logs:ro -
Ensure Traefik outputs JSON format
-
Check container logs:
docker compose logs log-dashboard-backend
Performance Issues
-
Reduce sampling rate in Traefik
-
Use GRPC instead of HTTP for OTLP
-
Limit logs in memory with environment variables
Development and Testing
The dashboard includes helpful development features:
# View backend logs
docker compose logs -f log-dashboard-backend

# Check OTLP receiver status
curl http://localhost:3001/api/otlp/status

# View real-time statistics
curl http://localhost:3001/api/stats | jq .
Conclusion
By integrating the enhanced Traefik Log Dashboard with OpenTelemetry support into your Pangolin stack, you gain unprecedented visibility into your traffic patterns. The combination of real-time OTLP traces, comprehensive log analysis, and geographic intelligence provides everything you need to monitor, debug, and optimize your infrastructure.
The dashboard’s hybrid approach means you can start with traditional log parsing and gradually adopt OpenTelemetry traces as you modernize your monitoring stack - all while maintaining complete visibility into your Traefik traffic.
Whether you’re troubleshooting performance issues, monitoring for security threats, or simply want to understand your traffic patterns better, this enhanced dashboard provides the insights you need in a clean, intuitive interface.
Happy monitoring!
For more advanced features, configuration options, and troubleshooting, visit the GitHub repository for comprehensive documentation and community support.