Detailed Guide: Creating a Grafana Dashboard for CrowdSec Metrics in Pangolin Stack- Part 1
I’ll guide you through setting up a Grafana dashboard to monitor your CrowdSec metrics step by step. This guide assumes you have your Pangolin stack with CrowdSec already running.
Part 1: Understanding the Components
- CrowdSec: Security automation tool that detects and responds to attacks
- Prometheus: Collects and stores metrics
- Grafana: Visualizes metrics in dashboards
Part 2: Setting Up Prometheus
Step 1: Create a Prometheus Configuration File
- Create a directory for Prometheus:
mkdir -p config/prometheus
- Create a prometheus.yml file:
nano config/prometheus/prometheus.yml
- Add the following configuration:
global:
  scrape_interval: 15s
  evaluation_interval: 15s

scrape_configs:
  - job_name: 'crowdsec'
    static_configs:
      - targets: ['crowdsec:6060']
Step 2: Add Prometheus to Your Docker Compose
- Edit your docker-compose.yml file:
nano docker-compose.yml
- Add the Prometheus service:
prometheus:
image: prom/prometheus:latest
container_name: prometheus
networks:
- pangolin
volumes:
- ./config/prometheus:/etc/prometheus
- ./config/prometheus_data:/prometheus
command:
- '--config.file=/etc/prometheus/prometheus.yml'
- '--storage.tsdb.path=/prometheus'
- '--web.console.libraries=/etc/prometheus/console_libraries'
- '--web.console.templates=/etc/prometheus/consoles'
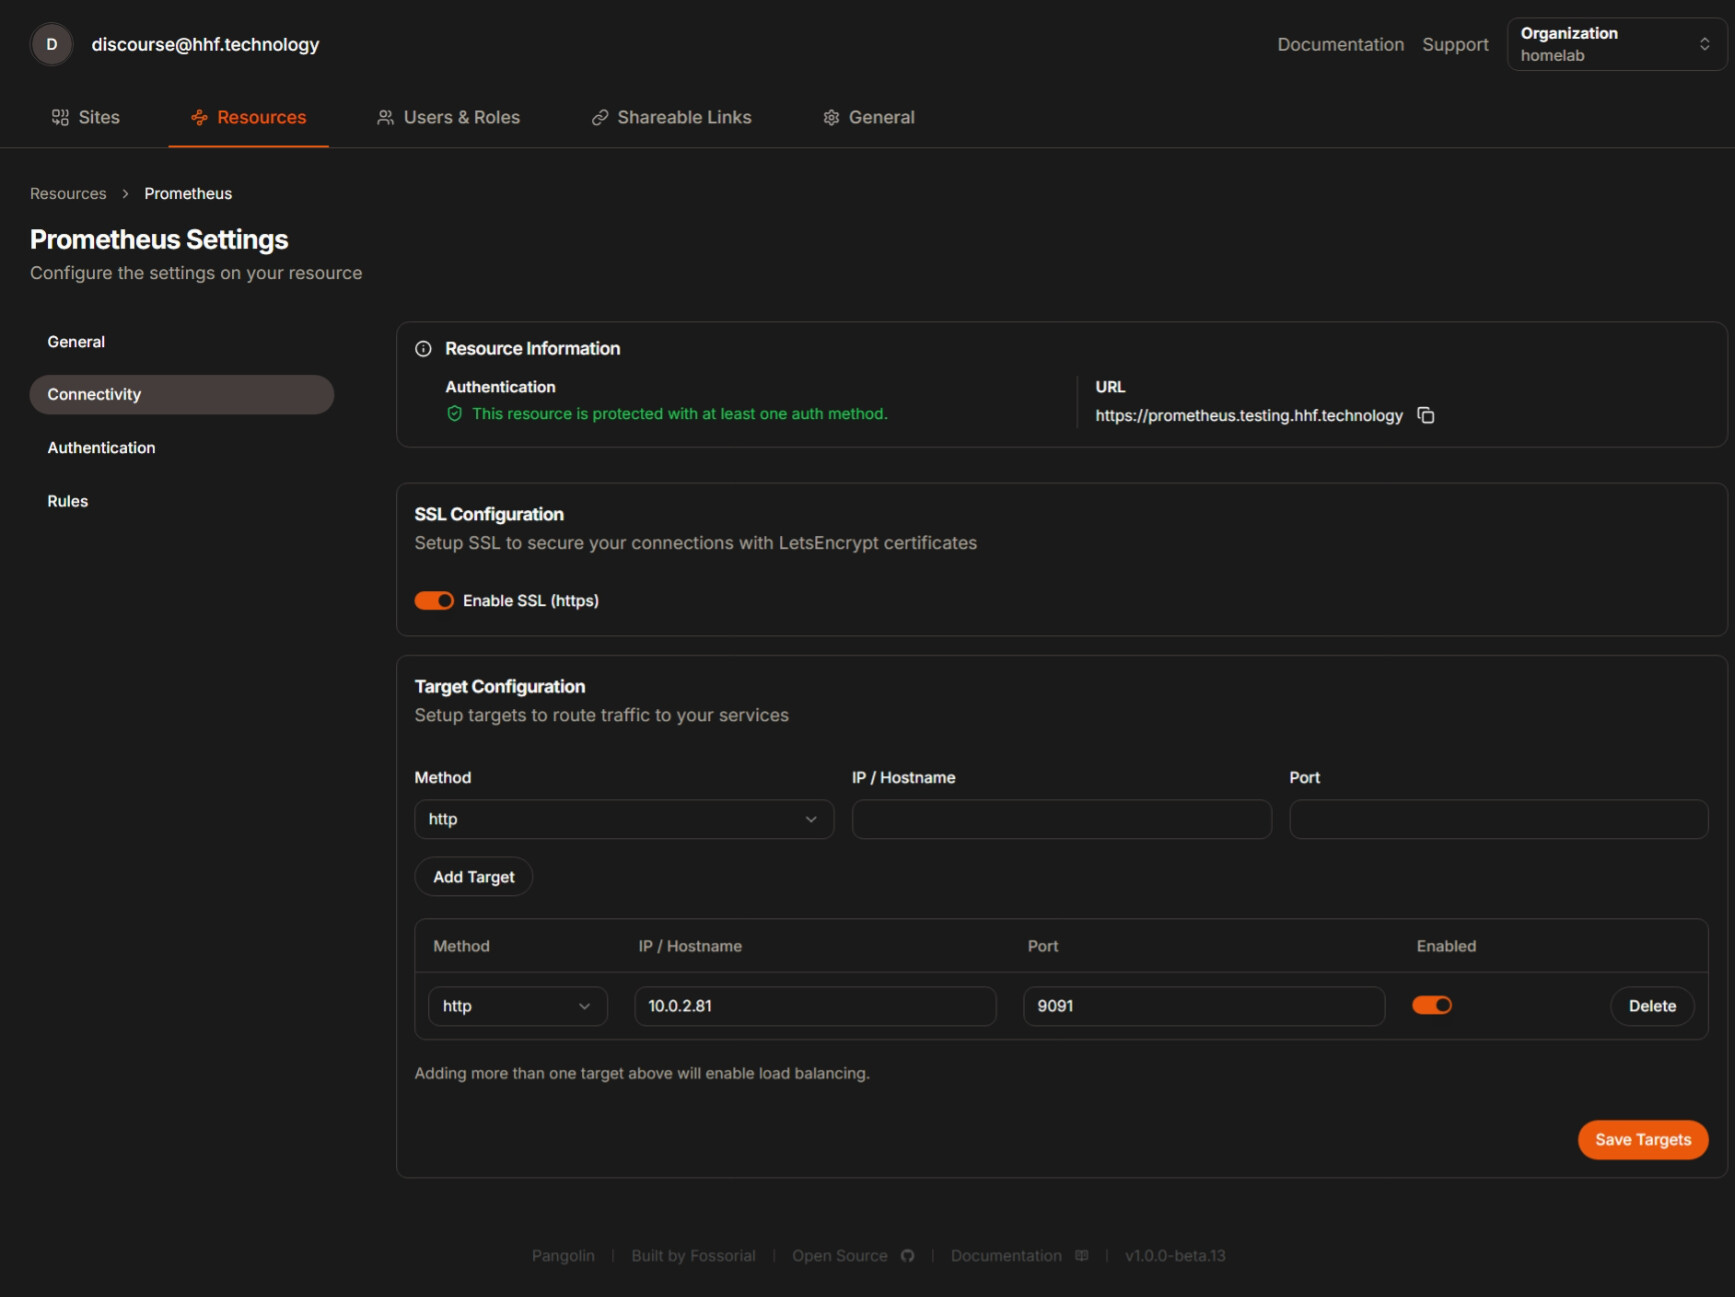
ports:
- "9091:9090"
restart: unless-stopped
Step 3: Apply Changes
- Apply the changes to your Docker Compose stack:
docker compose down
docker compose up -d
- Verify Prometheus is running:
docker ps | grep prometheus
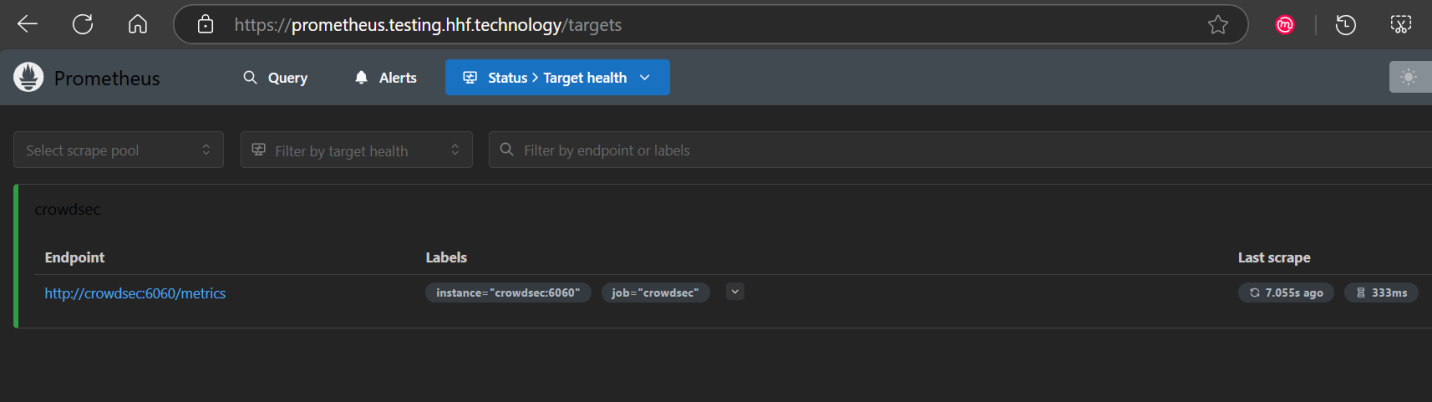
- Check if Prometheus is collecting metrics by visiting:
- http://your-server-ip:9091
- Go to Status > Targets to confirm CrowdSec is being scraped
Part 3: Setting Up Grafana
Step 1: Add Grafana to Docker Compose
- Edit your docker-compose.yml file again:
nano docker-compose.yml
- Add the Grafana service:
grafana:
image: grafana/grafana:latest
container_name: grafana
networks:
- pangolin
volumes:
- ./config/grafana:/var/lib/grafana
environment:
- GF_SECURITY_ADMIN_USER=admin
- GF_SECURITY_ADMIN_PASSWORD=strongpassword
- GF_USERS_ALLOW_SIGN_UP=false
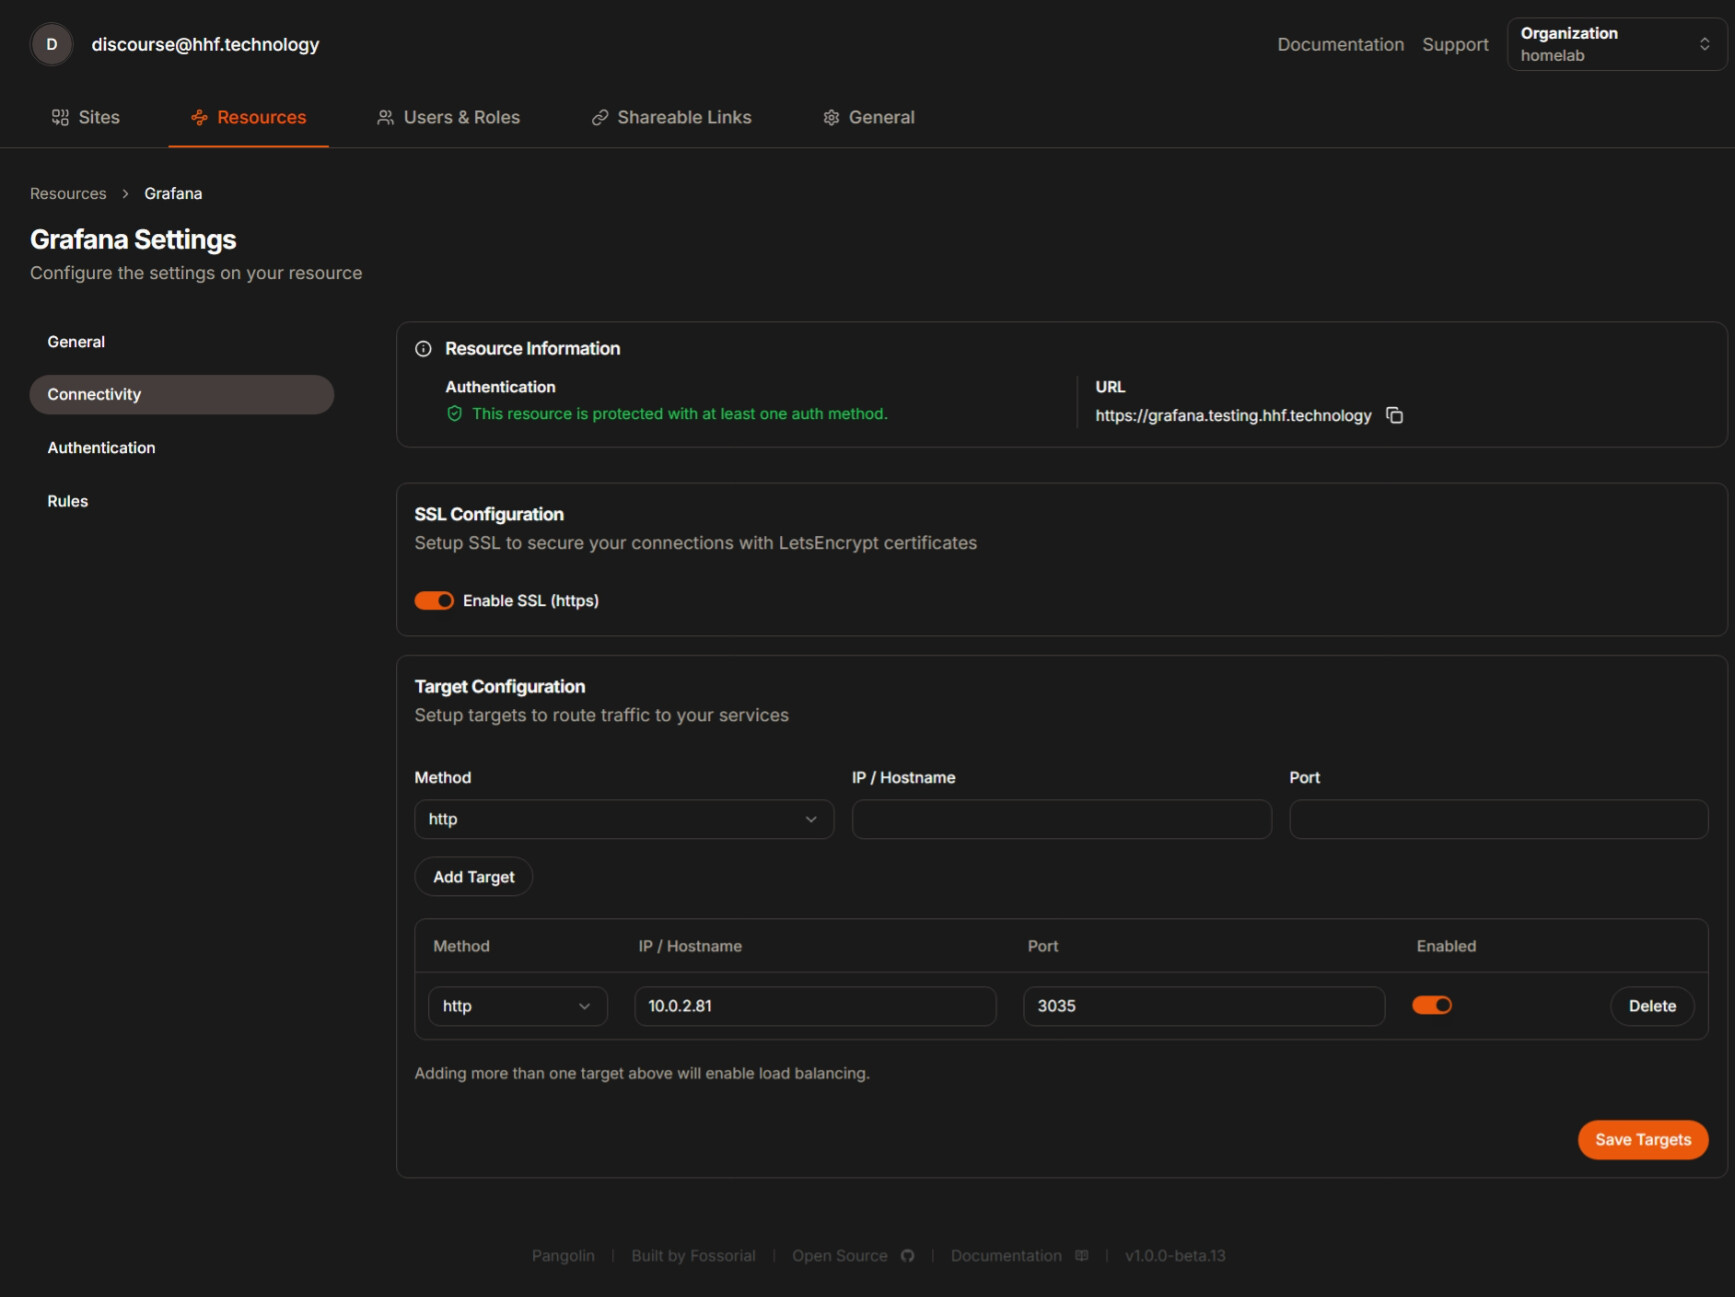
ports:
- "3035:3000"
restart: unless-stopped
- Apply the changes:
docker compose up -d
- Verify Grafana is running:
docker ps | grep grafana
Step 2: Configure Grafana
-
Access Grafana in your browser:
-
Log in with:
- Username: admin
- Password: strongpassword (or whatever you set in docker-compose)
-
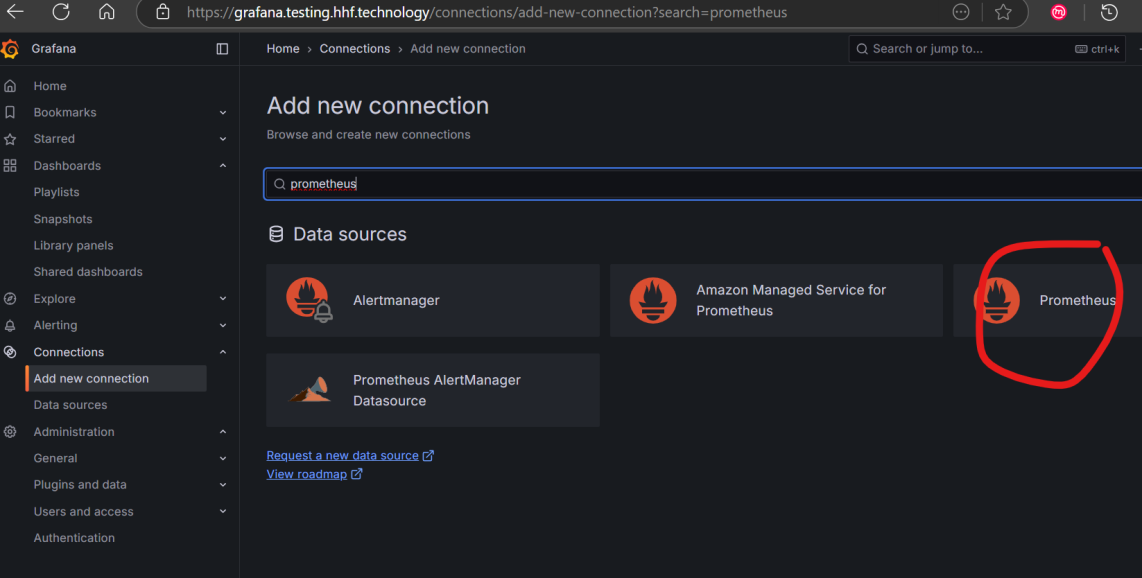
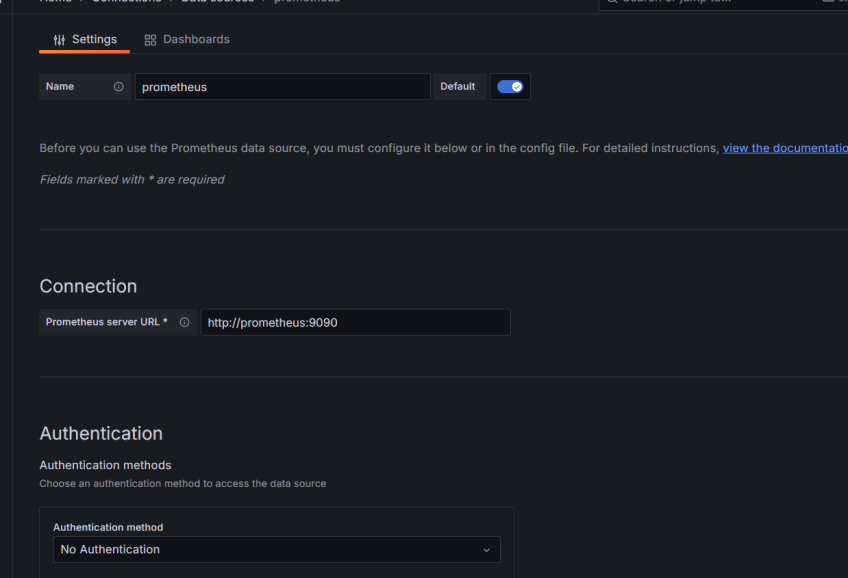
Add Prometheus as a data source:
- Click on “Configuration” (gear icon) in the left sidebar
- Select “Data sources”
- Click “Add data source”
- Select “Prometheus”
- Set URL to: http://prometheus:9090
- Click “Save & Test” to verify connection
Part 4: Creating the CrowdSec Dashboard
Step 1: Import a Pre-made Dashboard
- In Grafana, click the “+” icon in the left sidebar
- Select “Import”
- Enter dashboard ID: 21419 (CrowdSec official dashboard)
- Click “Load”
- Select your Prometheus data source
- Click “Import”
Step 2: Create a Custom Dashboard (Alternative)
If you prefer to build your own:
-
Click the “+” icon in the left sidebar
-
Select “Create Dashboard”
-
Click “Add new panel”
-
Configure the first panel to show active decisions:
- In the Query field enter:
crowdsec_active_decisions - Panel title: “Active Decisions”
- Visualization: “Stat”
- Click “Apply”
- In the Query field enter:
-
Add a panel for bouncer activity:
- Click “Add panel”
- Query:
crowdsec_bouncer_requests_total - Panel title: “Bouncer Requests”
- Visualization: “Time series”
- Click “Apply”
-
Add a panel for decisions by type:
- Click “Add panel”
- Query:
sum by (type) (crowdsec_decisions_total) - Panel title: “Decisions by Type”
- Visualization: “Pie Chart”
- Click “Apply”
-
Add a panel for top attacked IPs:
- Click “Add panel”
- Query:
topk(10, sum by (source_ip) (crowdsec_decisions_total)) - Panel title: “Top Attacked IPs”
- Visualization: “Bar Gauge”
- Click “Apply”
-
Save your dashboard:
- Click the save icon (disk) in the top right
- Give your dashboard a name: “CrowdSec Monitoring”
- Click “Save”
Part 5: Adding CrowdSec-Specific Panels
-
Add a panel for alerts by scenario:
- New panel
- Query:
sum by (scenario) (crowdsec_alerts_total) - Title: “Alerts by Scenario”
- Visualization: “Bar chart”
-
Add a panel for parser metrics:
- New panel
- Query:
sum by (parser) (crowdsec_parser_hits_total) - Title: “Parser Activity”
- Visualization: “Time series”
-
Add a panel for API metrics:
- New panel
- Query:
sum by (endpoint) (crowdsec_http_requests_total) - Title: “API Endpoint Activity”
- Visualization: “Time series”
Part 6: Troubleshooting
If you don’t see metrics:
- Check if CrowdSec is exposing metrics:
curl http://localhost:6060/metrics
- Verify Prometheus can reach CrowdSec:
docker exec -it prometheus wget -O- crowdsec:6060/metrics
- Check Prometheus logs:
docker logs prometheus
-
Check if the metrics are in Prometheus:
- Go to http://your-server-ip:9091
- Try querying:
crowdsec_active_decisions
-
Inspect your docker network:
docker network inspect pangolin
Part 7: Setting Up Alerts (Optional)
- In Grafana, go to Alerting in the left sidebar
- Click “New alert rule”
- Configure a rule, for example:
- Query:
sum(crowdsec_active_decisions) > 100 - Condition: When value is above 100
- For: 5m
- Set rule name: “High number of CrowdSec decisions”
- Query:
- Set notification channels (email, Slack, etc.)
- Save the rule
That’s it! You now have a complete Grafana dashboard to monitor your CrowdSec metrics from your Pangolin stack.
Full Compose file for Ref
networks:
  pangolin:
    driver: bridge
services:
  pangolin:
    image: public.ecr.aws/g5j5p7x0/pangolin2:pre1
    container_name: pangolin
    restart: unless-stopped
    networks:
      - pangolin
    volumes:
      - ./config:/app/config
    healthcheck:
      test: ["CMD", "curl", "-f", "http://localhost:3001/api/v1/"]
      interval: "3s"
      timeout: "3s"
      retries: 5

  gerbil:
    image: fosrl/gerbil:1.0.0-beta.3
    container_name: gerbil
    restart: unless-stopped
    depends_on:
      pangolin:
        condition: service_healthy
    networks:
      - pangolin
    command:
      - --reachableAt=http://gerbil:3003
      - --generateAndSaveKeyTo=/var/config/key
      - --remoteConfig=http://pangolin:3001/api/v1/gerbil/get-config
      - --reportBandwidthTo=http://pangolin:3001/api/v1/gerbil/receive-bandwidth
    volumes:
      - ./config/:/var/config
    cap_add:
      - NET_ADMIN
      - SYS_MODULE
    ports:
      - 51820:51820/udp
      - 8085:8080 # Port for traefik dashboard
      - 443:443 # Port for traefik because of the network_mode
      - 80:80 # Port for traefik because of the network_mode

  # Add CrowdSec services
  crowdsec:
    image: crowdsecurity/crowdsec:latest
    container_name: crowdsec
    environment:
      GID: "1000"
      COLLECTIONS: crowdsecurity/traefik crowdsecurity/appsec-virtual-patching crowdsecurity/appsec-generic-rules
      ENROLL_INSTANCE_NAME: "pangolin-crowdsec"
      PARSERS: crowdsecurity/whitelists
      ENROLL_KEY: dhoashdfosahosdhfoisdhfjhdfjsdpvjdsj
      ACQUIRE_FILES: "/var/log/traefik/*.log"
      ENROLL_TAGS: docker
    networks:
      - pangolin
    healthcheck:
      test: ["CMD", "cscli", "capi", "status"]
    depends_on:
      - gerbil
    labels:
      - "traefik.enable=false"
    volumes:
      # crowdsec container data
      - ./config/crowdsec:/etc/crowdsec
      - ./config/crowdsec/db:/var/lib/crowdsec/data
      # log bind mounts into crowdsec
      - ./config/crowdsec_logs/auth.log:/var/log/auth.log:ro
      - ./config/crowdsec_logs/syslog:/var/log/syslog:ro
      - ./config/crowdsec_logs:/var/log
      - ./config/traefik/logs:/var/log/traefik
    ports:
      - 8080:8080 # port mapping for local firewall bouncers
      - 6060:6060 # metrics endpoint for prometheus
    expose:
      - 8080 # http api for bouncers
      - 6060 # metrics endpoint for prometheus
      - 7422 # appsec waf endpoint
    restart: unless-stopped
    command: -t # Add test config flag to verify configuration


  traefik:
    image: traefik:v3.3.3
    container_name: traefik
    restart: unless-stopped

    network_mode: service:gerbil # Ports appear on the gerbil service

    depends_on:
      pangolin:
        condition: service_healthy

    command:
      - --configFile=/etc/traefik/traefik_config.yml
    volumes:
      - ./config/traefik:/etc/traefik:ro # Volume to store the Traefik configuration
      - ./config/letsencrypt:/letsencrypt # Volume to store the Let's Encrypt certificates
      - ./config/traefik/logs:/var/log/traefik
      - ./config/traefik/conf/:/etc/traefik/conf/
      - ./config/traefik/rules:/rules

  prometheus:
    image: prom/prometheus:latest
    container_name: prometheus
    networks:
      - pangolin
    depends_on:
      - crowdsec
    volumes:
      - ./config/prometheus:/etc/prometheus
      - ./config/prometheus_data:/prometheus
    command:
      - '--config.file=/etc/prometheus/prometheus.yml'
      - '--storage.tsdb.path=/prometheus'
      - '--web.console.libraries=/etc/prometheus/console_libraries'
      - '--web.console.templates=/etc/prometheus/consoles'
    ports:
      - 9091:9090
    restart: unless-stopped
  grafana:
    image: grafana/grafana:latest
    container_name: grafana
    networks:
      - pangolin
    depends_on:
      - crowdsec
    volumes:
      - ./config/grafana:/var/lib/grafana
    environment:
      - GF_SECURITY_ADMIN_USER=admin12
      - GF_SECURITY_ADMIN_PASSWORD=strongpassword1
      - GF_USERS_ALLOW_SIGN_UP=false
    ports:
      - 3035:3000
    restart: unless-stopped