CrowdSec & Pangolin Stack Troubleshooting Guide
Introduction
This guide will help you use the CrowdSec and Pangolin Stack Diagnostic Tool to troubleshoot and resolve issues with your CrowdSec integration. The diagnostic tool is designed to check the health of your containers, verify the configuration of CrowdSec with Traefik, and identify common integration problems.
CrowdSec is a security automation tool that detects and responds to threats, while Pangolin is your application stack. When properly integrated, CrowdSec helps protect your Pangolin applications from various cyber threats.
Prerequisites
Before using this diagnostic tool, ensure you have:
- Access to the server running your Pangolin stack
- Docker and Docker Compose installed
- Basic knowledge of Linux commands
- sudo/root privileges (or appropriate permissions to run docker commands)
- Run/Download it where your pangolin docker-compose.yml file is located.(very imp)
Setting Up the Diagnostic Tool
- Download the diagnostic script:
curl -o crowdsec-check.sh https://gist.githubusercontent.com/hhftechnology/76788752ab4faaebff94bd4932d7be99/raw/605c48b584cf2f9279694cc5ab7030671697336a/crowdsec-check.sh
- Make the script executable:
chmod +x crowdsec-check.sh
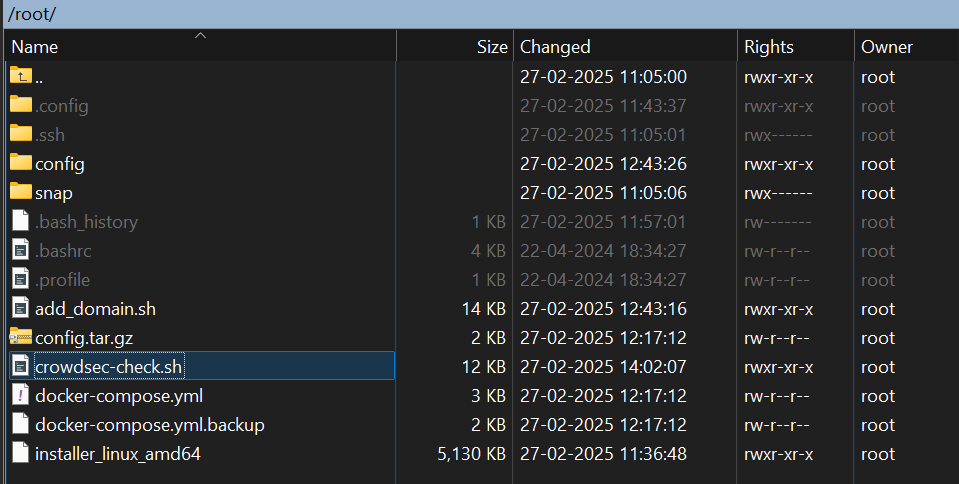
- Run the script from the same directory where your Docker Compose file is located:
./crowdsec-check.sh
https://asciinema.org/a/eDIXYiEBdxld1OBTFySd3rGfr
Understanding the Main Menu
When you run the script, you’ll see a menu with various diagnostic options:
======================================================================
   CROWDSEC & PANGOLIN STACK DIAGNOSTIC TOOL
======================================================================

1. Check Container Health
2. Check CrowdSec Bouncers
3. Check CrowdSec Decisions
4. Check CrowdSec Metrics
5. Check Traefik CrowdSec Integration
6. View Recent Logs (All Services)
7. View Recent CrowdSec Logs
8. View Recent Traefik Logs
9. View Recent Pangolin Logs
10. View Recent Gerbil Logs
11. Follow CrowdSec Logs (Live) - Use Ctrl+C to exit
12. Run Complete Diagnostic Check
0. Exit
Option Descriptions
Let’s understand what each option does:
1. Check Container Health
This checks if all necessary containers (CrowdSec, Traefik, Pangolin, and Gerbil) are running. It’s the first step in diagnosing any issues.
When to use: Use this when you suspect one or more services might be down.
2. Check CrowdSec Bouncers
This verifies that Traefik is properly registered as a bouncer with CrowdSec. Bouncers are components that enforce decisions made by CrowdSec.
When to use: Use this when CrowdSec is running but doesn’t seem to be blocking threats.
3. Check CrowdSec Decisions
This shows current blocks, captchas, or other actions that CrowdSec has decided to take against potentially malicious IPs.
When to use: When you want to see if CrowdSec is detecting and responding to threats.
4. Check CrowdSec Metrics
This displays performance and operational metrics from CrowdSec, including AppSec-specific metrics.
When to use: When you want to verify CrowdSec is processing traffic and analyzing for threats.
5. Check Traefik CrowdSec Integration
This verifies that Traefik is properly configured to use CrowdSec as a middleware.
When to use: When CrowdSec is running but doesn’t appear to be working with Traefik.
6-10. View Logs
These options show recent logs for various components of the stack.
When to use: When you need to investigate specific errors or behaviors in a component.
11. Follow CrowdSec Logs (Live)
This displays CrowdSec logs in real-time, updating as new events occur.
When to use: When you want to monitor CrowdSec’s behavior during testing or in response to an ongoing issue.
12. Run Complete Diagnostic Check
This runs all diagnostic checks and provides a comprehensive summary of your CrowdSec integration.
When to use: When you first encounter issues or want a complete health check of your system.
Interpreting Diagnostic Results
The diagnostic tool uses color-coded output to help you quickly identify issues:
- Green (✓): Everything is working correctly
- Red (✗): There’s an issue that needs attention
- Yellow: Informational messages or warnings
- Blue: Section headers
Understanding Key Checks
Container Health
If any containers show as not running:
- Check Docker Compose status:
docker compose ps - Review container logs for errors:
docker compose logs [container_name] - Verify container configuration in your docker-compose.yml
CrowdSec Bouncers
If the Traefik bouncer is not registered:
- Verify the API key in your Traefik configuration matches the one registered in CrowdSec
- Check that Traefik can communicate with CrowdSec (network configuration)
- Ensure the CrowdSec bouncer was properly added with:
docker exec crowdsec cscli bouncers add traefik-bouncer
Traefik CrowdSec Integration
If CrowdSec middleware is not found in Traefik configuration:
- Verify your
dynamic_config.ymlcontains the CrowdSec middleware configuration - Check that middleware is properly referenced in your routes
- Ensure the middleware is using the correct syntax (e.g.,
crowdsec@file)
Common Issues and Solutions
CrowdSec Container Not Running
Issue: The CrowdSec container shows as not running.
Potential Solutions:
- Try restarting the container:
docker compose restart crowdsec - Check logs for errors:
docker compose logs crowdsec - Verify the CrowdSec configuration in your docker-compose.yml
- Ensure CrowdSec has the correct permissions to access required directories
Traefik Not Using CrowdSec Middleware
Issue: Traffic is not being blocked despite CrowdSec detecting threats.
Potential Solutions:
- Verify middleware configuration in
dynamic_config.yml - Check that routes are properly using the middleware
- Ensure the LAPI key is correct
- Confirm AppSec is enabled if you’re trying to protect against application-level attacks
No AppSec Metrics
Issue: AppSec metrics are not appearing despite AppSec being enabled.
Potential Solutions:
- Verify
crowdsecAppsecEnabled: trueis set in your configuration - Check if the CrowdSec bouncer is properly registered
- Ensure traffic is actually flowing through protected routes
- Review CrowdSec logs for any AppSec-related errors
CrowdSec Not Detecting Threats
Issue: No decisions are being made despite suspicious traffic.
Potential Solutions:
- Check that appropriate scenarios are enabled:
docker exec crowdsec cscli scenarios list - Verify log parsers are working:
docker exec crowdsec cscli parsers list - Ensure logs are being properly forwarded to CrowdSec
- Check CrowdSec’s acquisition configuration
Advanced Diagnostics
Testing CrowdSec Detection
You can test if CrowdSec is properly detecting threats by simulating an attack. For example, to test if CrowdSec detects brute force attempts:
- Make multiple failed login attempts to your application
- Run option 3 (Check CrowdSec Decisions) to see if the IP gets blocked
- Check CrowdSec logs (option 7) for detection events
Examining Traefik Traffic
To verify Traefik is properly routing traffic through the CrowdSec middleware:
- Enable debug logging in Traefik by setting
log.level: DEBUGin your Traefik configuration - Restart Traefik:
docker compose restart traefik - Generate some traffic to your application
- Run option 8 (View Recent Traefik Logs) and look for middleware references
Checking CrowdSec Configuration
To inspect the actual CrowdSec configuration:
docker exec crowdsec cat /etc/crowdsec/config.yaml
Validating Traefik Middleware
To verify Traefik can read your middleware configuration correctly:
docker exec traefik traefik healthcheck
Troubleshooting Workflow
When facing issues with CrowdSec integration, follow this workflow:
- Run the complete diagnostic (option 12) to get an overview of your system’s health
- Address container issues first - ensure all containers are running
- Check middleware configuration - verify CrowdSec is properly configured in Traefik
- Inspect logs - use the log viewing options to identify specific errors
- Test remediation - after making changes, run the complete diagnostic again to verify improvements
When to Seek Additional Help
If you’ve tried the diagnostic tool and still can’t resolve your issues:
- Save the output from a complete diagnostic run
- Export your logs:
docker compose logs > pangolin-crowdsec-logs.txt - Gather your configuration files (with sensitive information redacted)
- Contact Pangolin support with these details
Conclusion
The CrowdSec and Pangolin Stack Diagnostic Tool helps you quickly identify and resolve integration issues between CrowdSec and your Pangolin stack. By systematically checking container health, middleware configuration, and system logs, you can ensure your applications remain protected against cyber threats.
Remember that security is a continuous process. Regularly run the diagnostic tool to verify that your CrowdSec integration remains healthy, especially after updates to any component of your stack.